Review: Lessons 12–17 on one chart
Why this chart
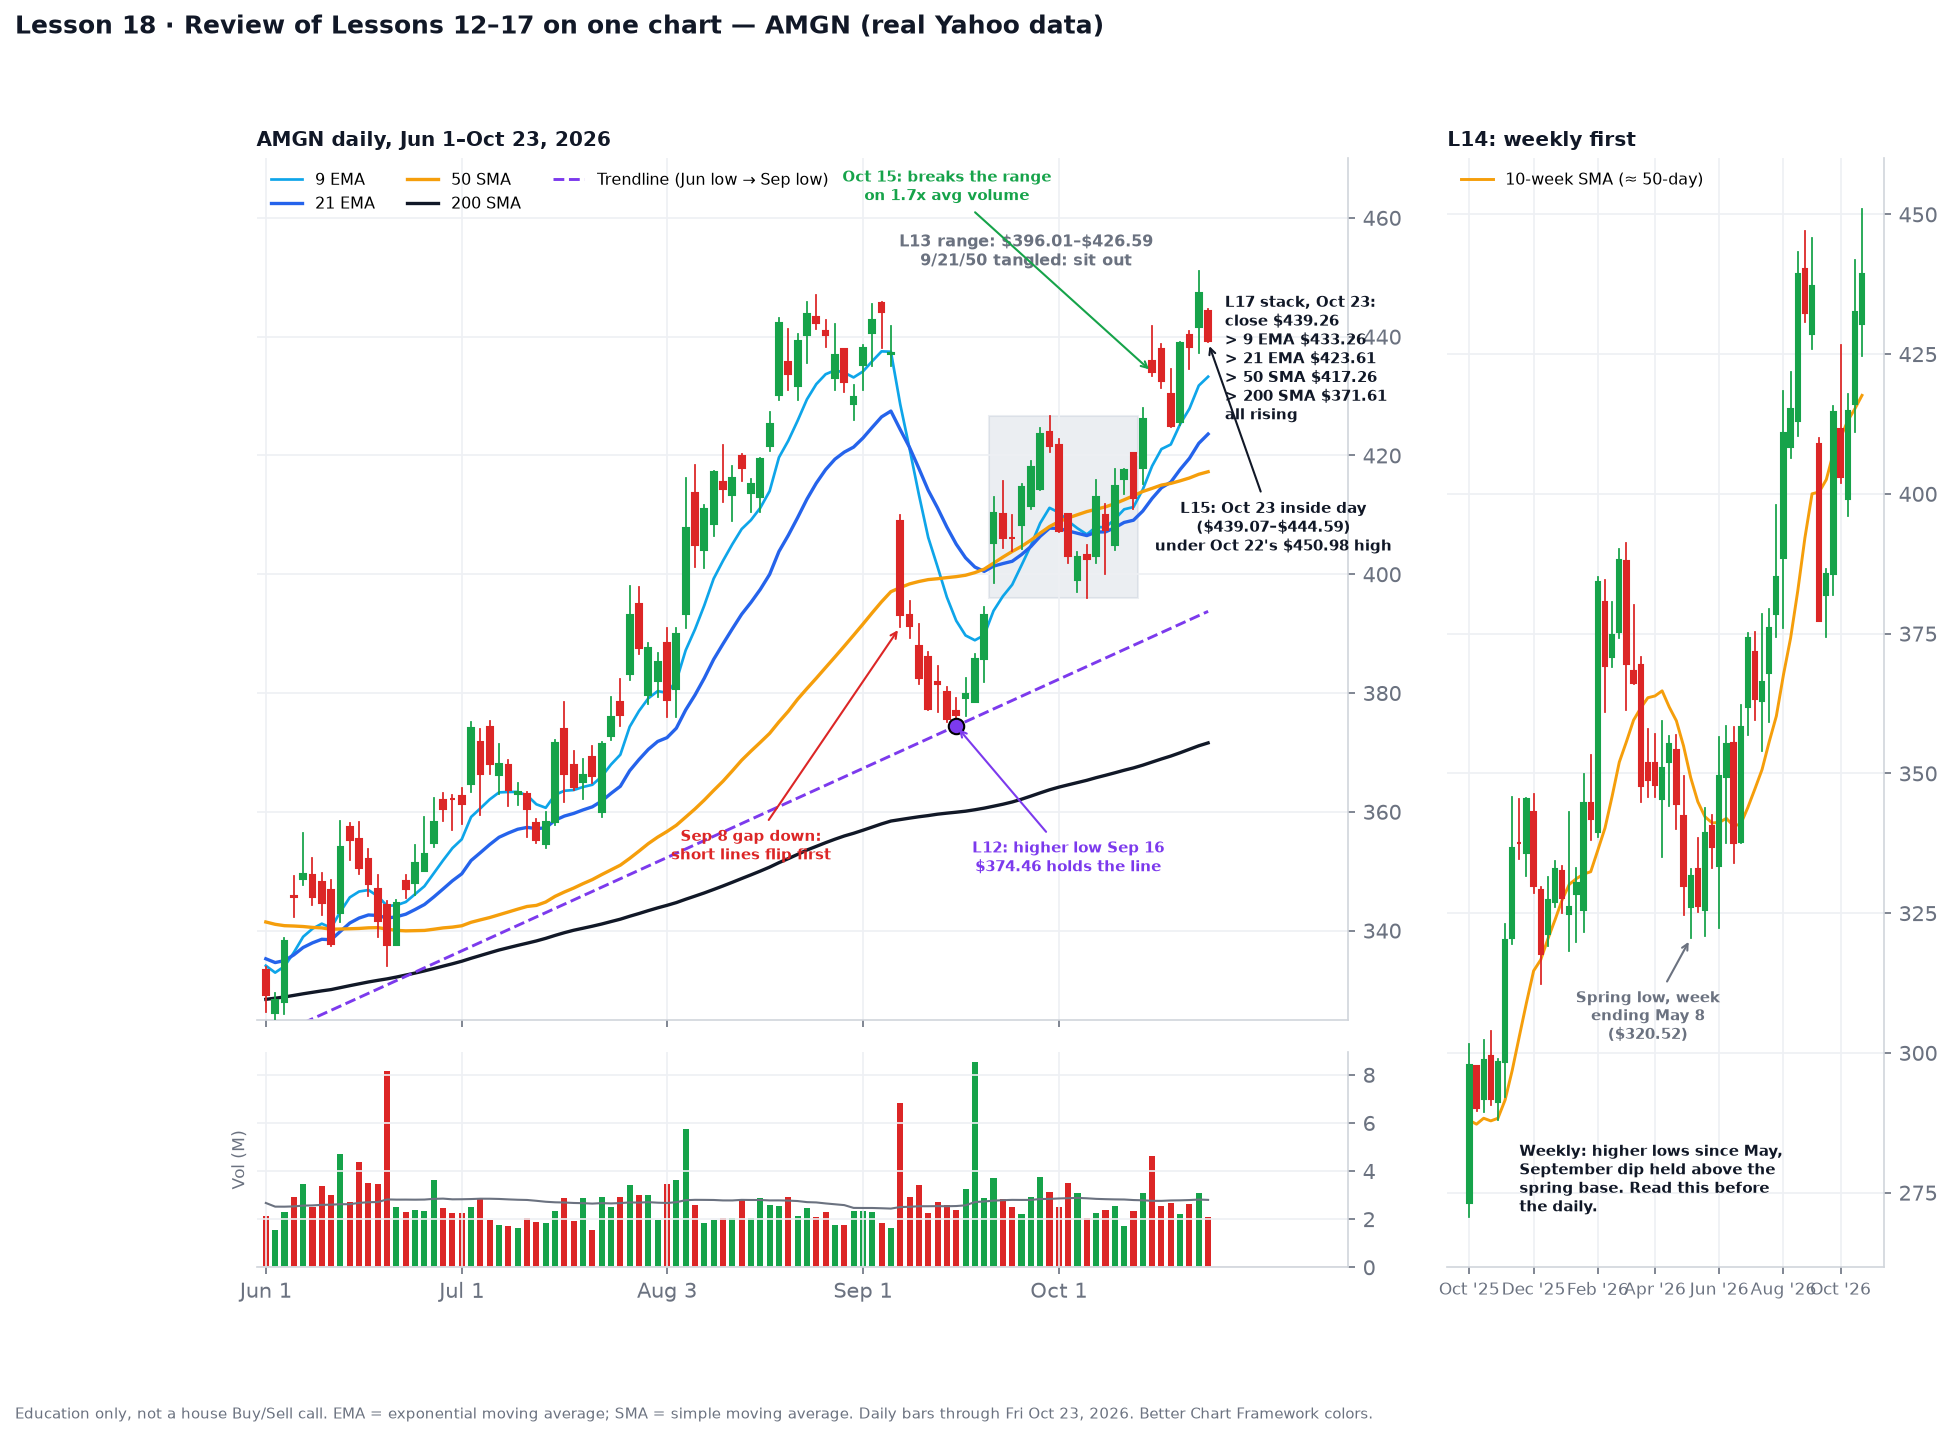
Amgen (AMGN) packs the whole last week of lessons into one five-month stretch: a trendline that held, a range you should have sat out, a breakout on volume, an inside day right at the high, and a moving-average stack that broke in September and repaired itself in October. Try the quiz first, using only the chart. Then read the answers.
Quiz
- Q1 (weekly first, Lesson 14). Before looking at the daily chart, what does the weekly panel tell you about the big trend?
- Q2 (trendlines, Lesson 12). Which two points anchor the purple trendline, and is it still valid?
- Q3 (ranges, Lesson 13). From Sep 22 to Oct 13, should you have traded it or sat out? What ended the range?
- Q4 (EMA vs SMA, Lesson 16). After the Sep 8 gap down, which 21-day line turned back up first, and by how much earlier?
- Q5 (inside days and the stack, Lessons 15 and 17). What is Oct 23 telling you, and how does the stack read right now?
Answers
- A1. The weekly chart shows an uptrend. The spring low was $320.52 in the week ending May 8. Every pullback since then has bottomed higher, and the September dip, the sharpest one, stopped at $374.46, far above that spring base. So you read the daily chart expecting the uptrend to continue, not end.
- A2. It connects the Jun 2 low ($322.30) and the Sep 16 low ($374.46). No daily close has been below it since Jun 2, so it’s still valid. On Oct 23 it sits near $393.75, about $45 under price. That’s too far away to use as a stop, but it’s still the line that defines the trend.
- A3. You should have sat out. For three weeks price swung between $396.01 (Oct 6) and $426.59 (Sep 30), and the 9 EMA, 21 EMA and 50 SMA stayed within $1–8 of each other the whole time. Lines tangled like that mean there is no trend to trade. The range ended on Oct 15, when AMGN gapped up and closed at $434.03, above the box, on about 1.7 times its 50-day average volume.
- A4. The 21 EMA bottomed on Sep 21 (about $400.48) and turned up. The 21 SMA didn’t bottom until Oct 6 ($397.74), 11 sessions later. The EMA weighs recent days more heavily, so it caught the recovery sooner. The SMA was slower but steadier: it never gave a false turn in the middle of the range.
- A5. Oct 23 was an inside day: its range ($439.07–444.59) sat entirely inside Oct 22’s range ($437.19–450.98), and Oct 22 was the high of this whole chart. It’s a pause after a new high, not a signal on its own. A move above $444.59 or below $439.07 shows which way the pause breaks. The stack is fully bullish again: the close ($439.26) is above the 9 EMA ($433.26), which is above the 21 EMA ($423.61), the 50 SMA ($417.26) and the 200 SMA ($371.61). All four are rising, and the 200 SMA rose $9.48 over the last 20 sessions.
What to notice
- The order matters: weekly trend, then structure (the trendline and the range), then the moving averages, then that day’s candle. Each step narrows the question.
- The Sep 8 gap (close $393.17, from $437.23 the session before, on about 6.8 million shares) broke the short lines but not the trendline or the weekly uptrend. The fast lines flip first; the structure tells you whether the flip matters.
- Patience paid. A trader who waited for a close outside the box got one clear move in place of three weeks of whipsaw.
Common mistake
Reading one tool in isolation. If you looked only at the 9 and 21 EMAs on Sep 9, you’d have called the trend broken. The weekly chart and the trendline said it was a pullback. When your tools disagree, the slower ones, read first, get the deciding vote.
Try it
Pick a stock you follow and go through the same five questions in order: the weekly trend, the trendline, range or trend, which 21-day line turned first, and the latest candle plus the stack. Write one line for each. If you can’t answer one, that’s the lesson to reread.
Up next
Lesson 19 (Tuesday): the 9 EMA as the momentum lane, and how strong leaders ride it.
Charts use real Yahoo daily data through Fri Oct 23, 2026. Part of Invest’s 90-day chart course.