The 9 EMA is the momentum lane
The one idea
The 9-day exponential moving average is the fastest line on the house chart. When a stock is in a strong run, its daily closes tend to stay on top of the 9 EMA, pulling back to it and bouncing. Think of it as a lane: while the stock closes inside it, momentum is intact. When it starts closing under the 9, the sprint has slowed to a jog, and the slower 21 EMA takes over as the line that matters.
The lane is open when three things are true together: the close is above the 9 EMA, the 9 EMA is above the 21 EMA, and the 9 is pointing up.
What ISRG showed this fall
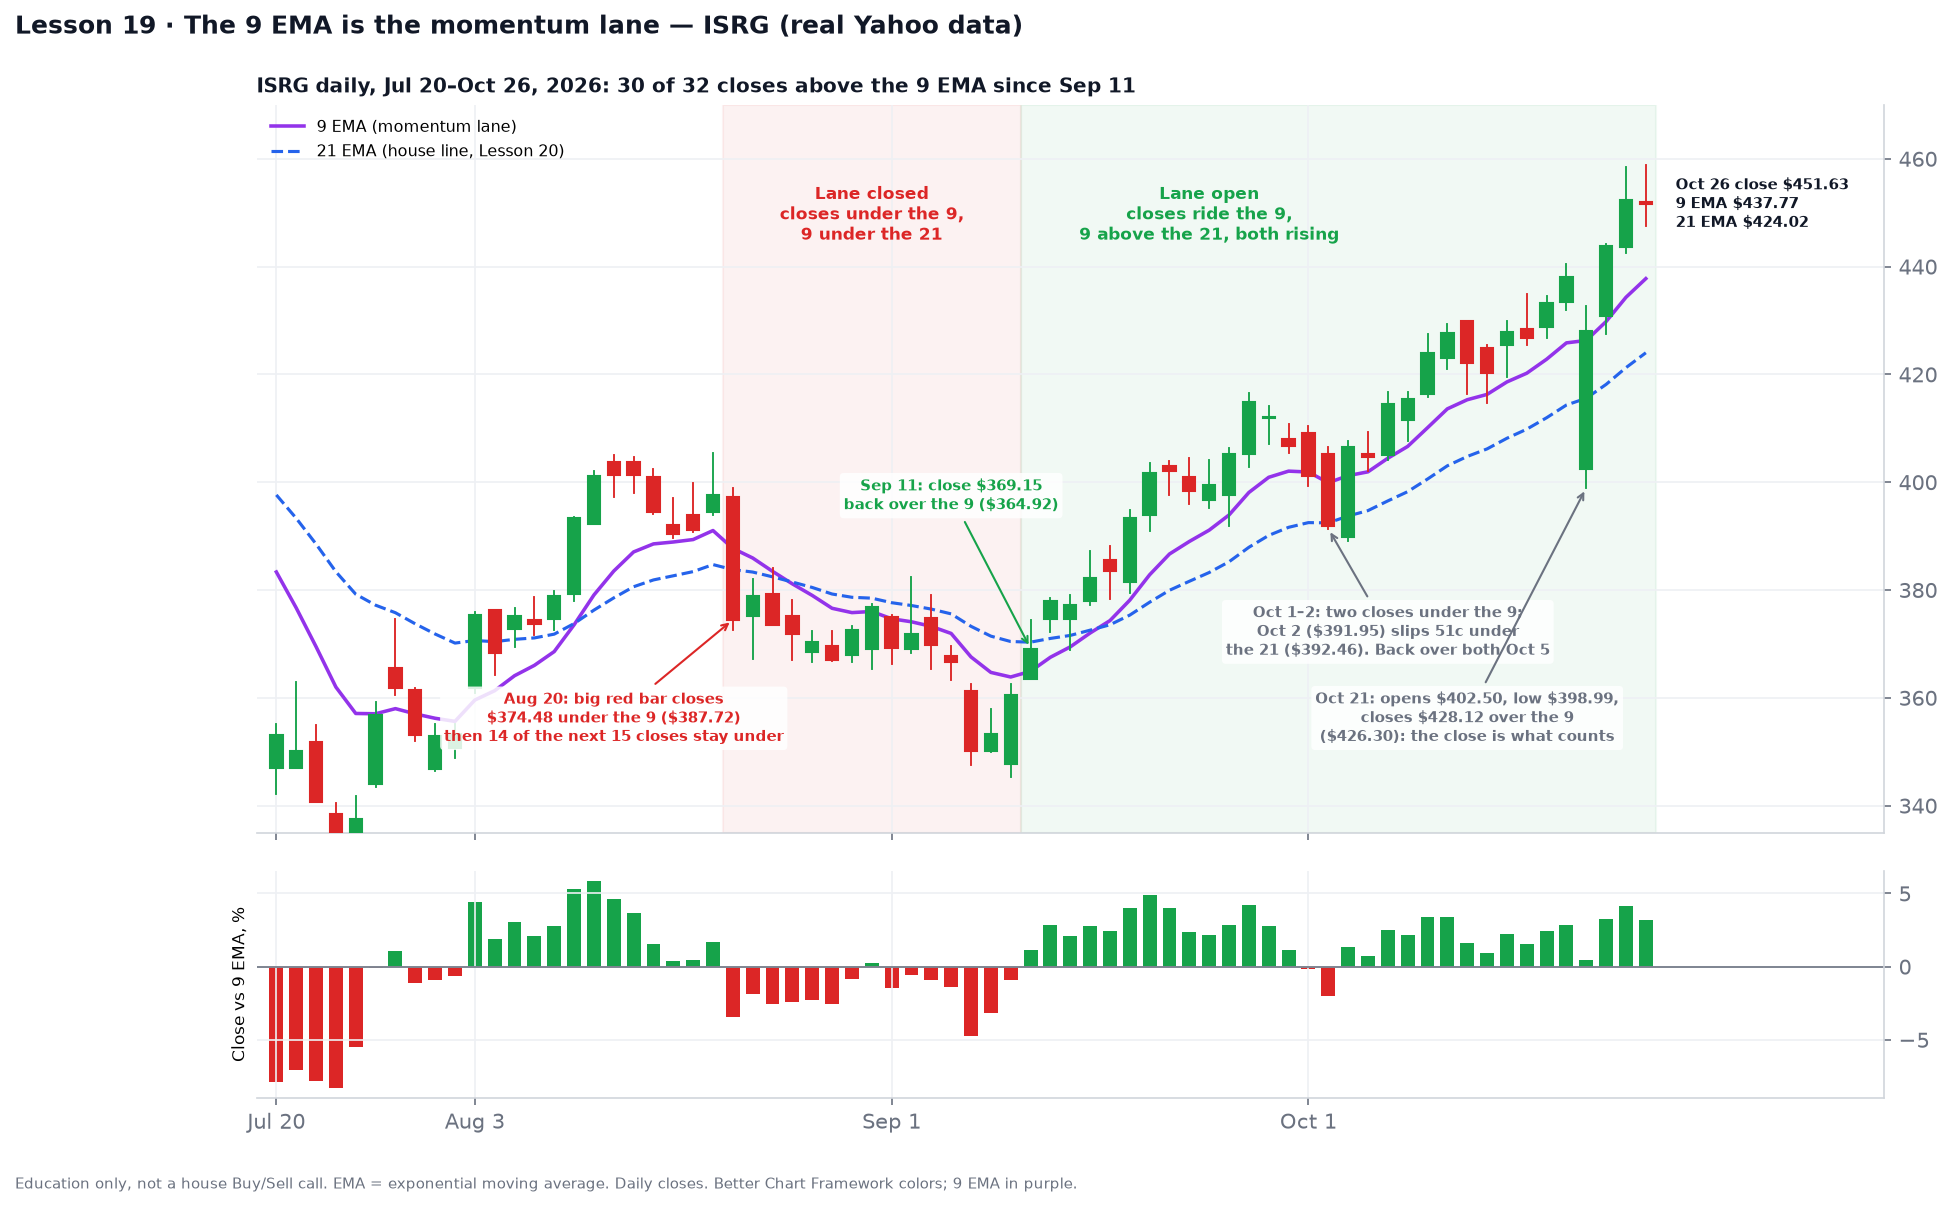
- The lane closing (Aug 20): a big red day closed at $374.48, well under the 9 EMA ($387.72). Over the next 15 sessions, 14 closes stayed under the 9, the 9 crossed below the 21, and the stock drifted to a $350.16 close on Sep 8.
- The lane reopening (Sep 11): ISRG closed at $369.15, back above the 9 EMA ($364.92). Within days the 9 was rising and back over the 21.
- Riding it: from Sep 11 through Oct 26, 30 of 32 closes were above the 9 EMA. From the Sep 10 close of $360.46 to the Oct 26 close of $451.63, the stock gained about 25%.
- A wobble, not a break (Oct 1–2): two closes slipped under the 9, and on Oct 2 the close ($391.95) was 51 cents under the 21 ($392.46). On Oct 5 it closed back over both. A shallow, brief dip like this is how strong lanes usually pause.
- The close is what counts (Oct 21): ISRG opened at $402.50 and traded down to $398.99, far under the 9 EMA, but it closed at $428.12, above the 9 ($426.30). Intraday it looked broken; by the close the lane was still open.
How far is too far?
The lower panel shows each close’s percent distance above or below the 9 EMA. During this run, ISRG’s biggest stretch was about 4.9% above the 9 (Sep 21), and on Oct 26 it was about 3.2% above ($451.63 vs $437.77). Every stock has its own normal stretch. Buying when a name is at the top of its usual stretch means you’re buying the spot where it usually pauses or snaps back toward the 9.
How the house uses the 9
- Timing adds: in a stock whose lane is open, a pullback that touches or comes near the 9 EMA and holds on a closing basis is a lower-risk spot to start or add than a big up day.
- A warning, not a sell: one close under the 9 means momentum is cooling. The sell discipline lives on the 21 EMA, which is tomorrow’s lesson.
- Skip the lane in sideways stocks: in a range (Lesson 13), price crosses the 9 constantly and it tells you nothing.
Rule of thumb
Read the 9 on closes only. Close above it with the 9 rising: the lane is open. Close under it: momentum is pausing, so watch the 21. Price far above it: wait for it to come back toward the line before you buy.
Common mistake
Treating an intraday poke below the 9 as a broken trend. ISRG on Oct 21 is the example: it was more than $27 under the 9 at the low and still closed above it. The other mistake is the reverse, selling a whole position on the first close under the 9, when strong stocks routinely wobble under it for a day or two, like ISRG did Oct 1–2.
Try it
Take a stock you follow or watch and add a 9 EMA and a 21 EMA. Count how many of its last 30 closes were above the 9. If it’s 25 or more with the 9 above the 21, the lane is open. Then find its biggest percent stretch above the 9 in that stretch, and note where today’s close sits against it.
Up next
Lesson 20 (Wednesday): the house rule, where the 21 EMA is the line in the sand for holding or exiting.
Charts use real Yahoo daily data through Mon Oct 26, 2026. Part of Invest’s 90-day chart course.