Spot the moving average (weekend drill)
How to do it
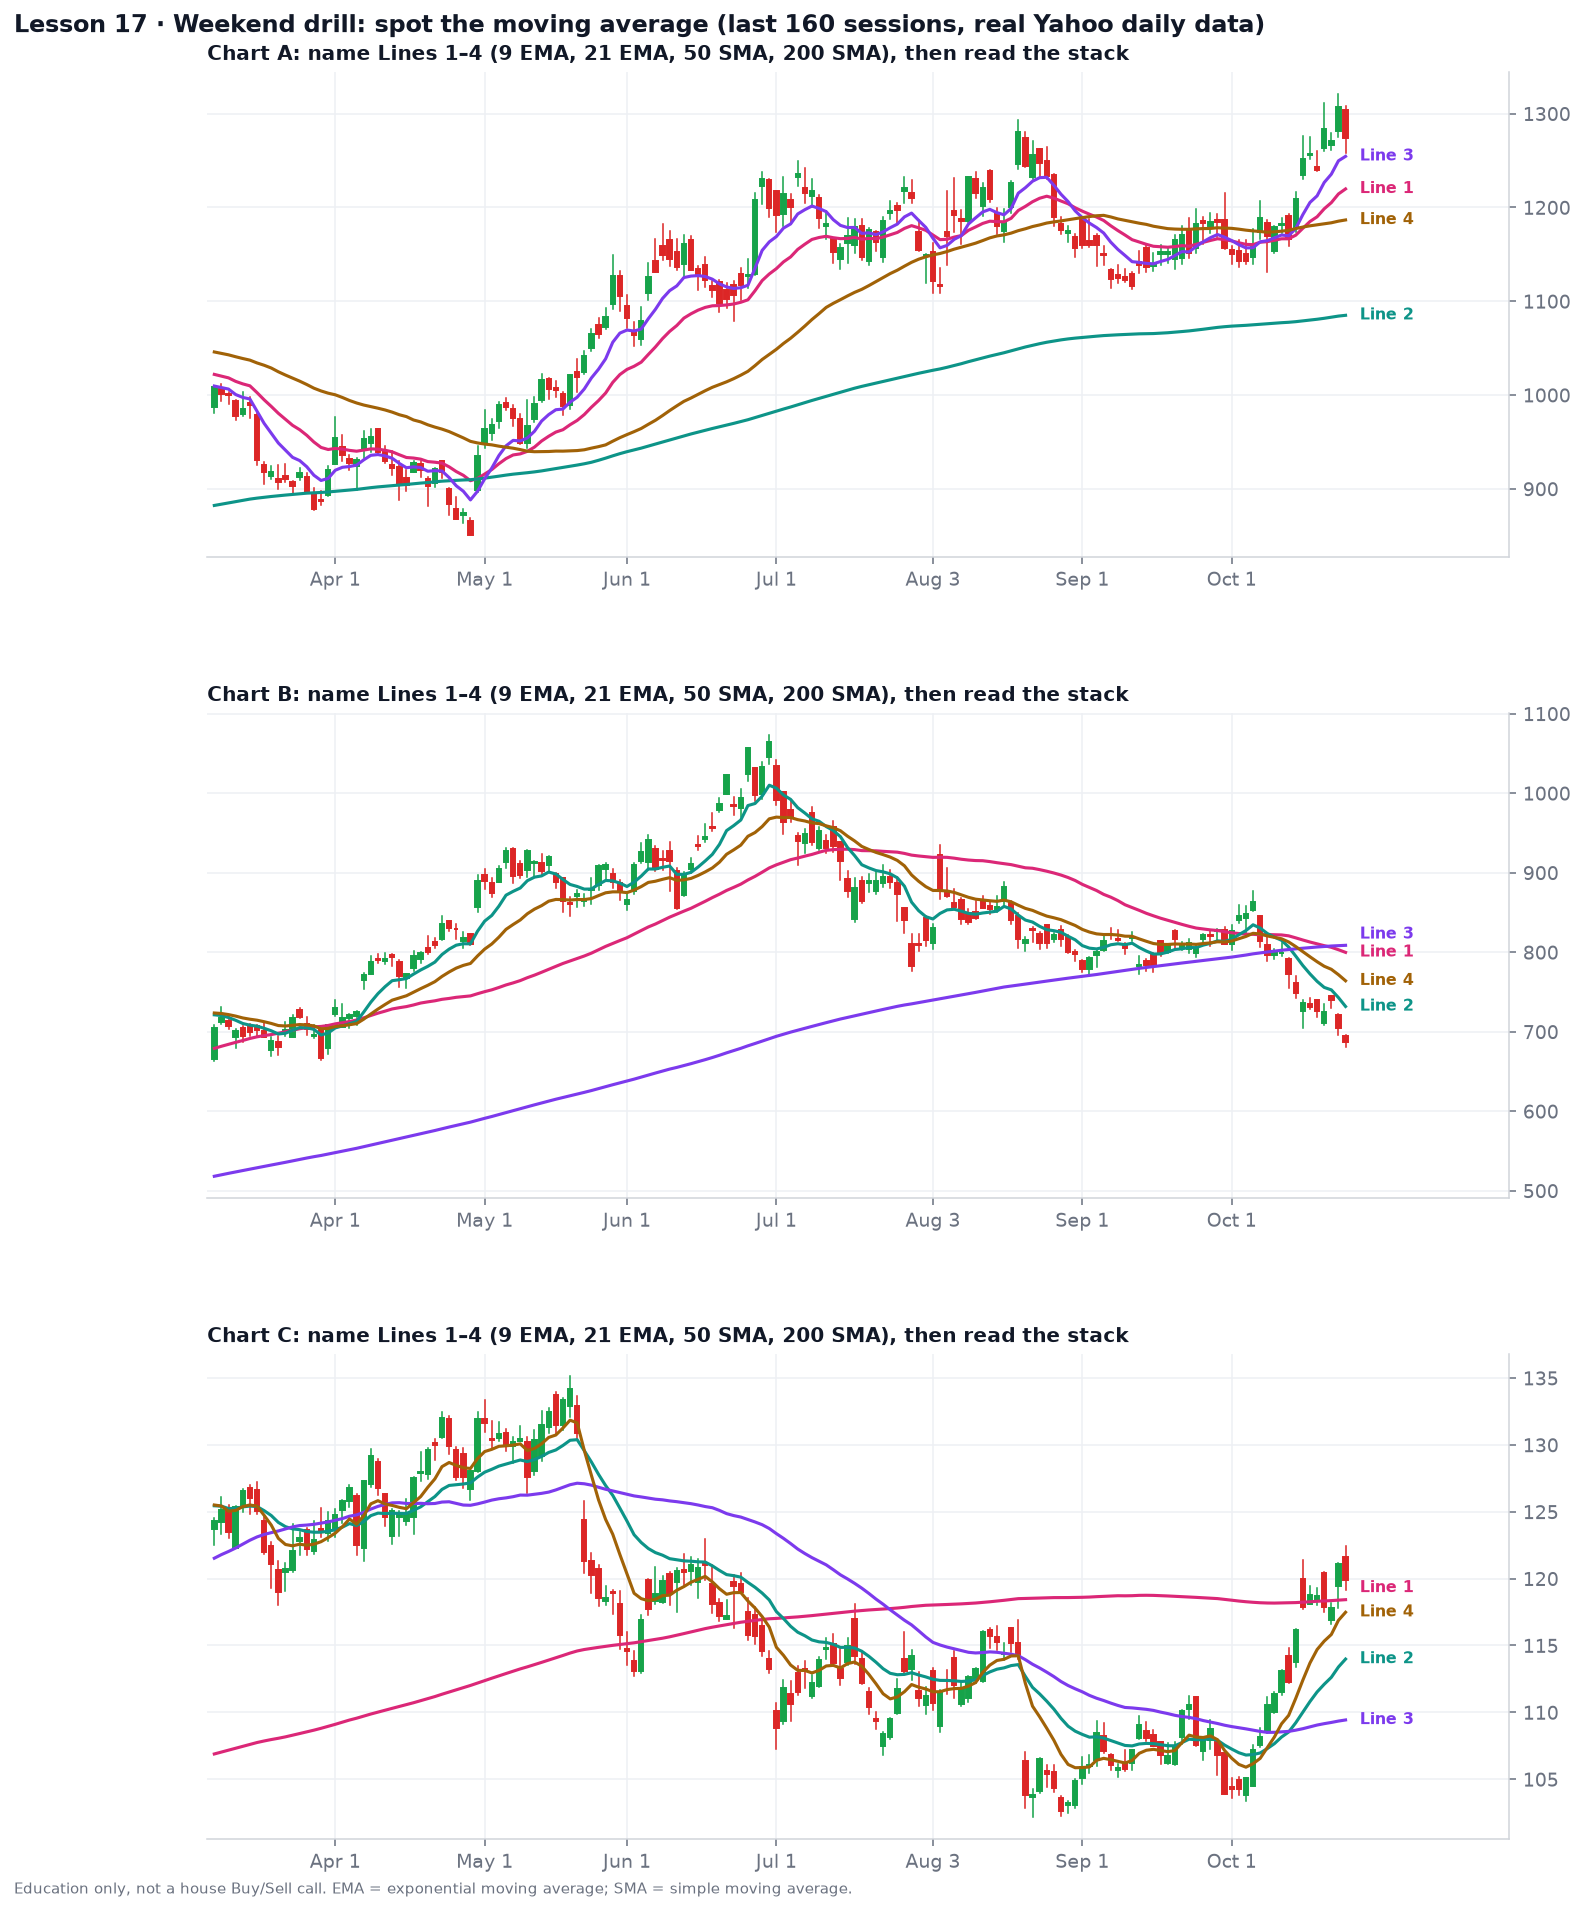
Each chart has the four house lines: the 9 EMA, 21 EMA, 50 SMA and 200 SMA. The numbers are shuffled on every chart, so you can’t just memorize the order. For each chart:
- Name Lines 1–4.
- Read the stack from top to bottom. Is it bullish (price above 9 above 21 above 50 above 200), bearish (the reverse), or mixed?
- Check the slope of the slowest line. Is the big trend still rising, falling, or flat?
Clues: the faster the line, the tighter it hugs the candles and the more it wiggles. The 9 EMA turns within days; the 21 EMA turns a bit later; the 50 SMA bends over weeks; the 200 SMA is close to a straight line and is often far from price.
Answers
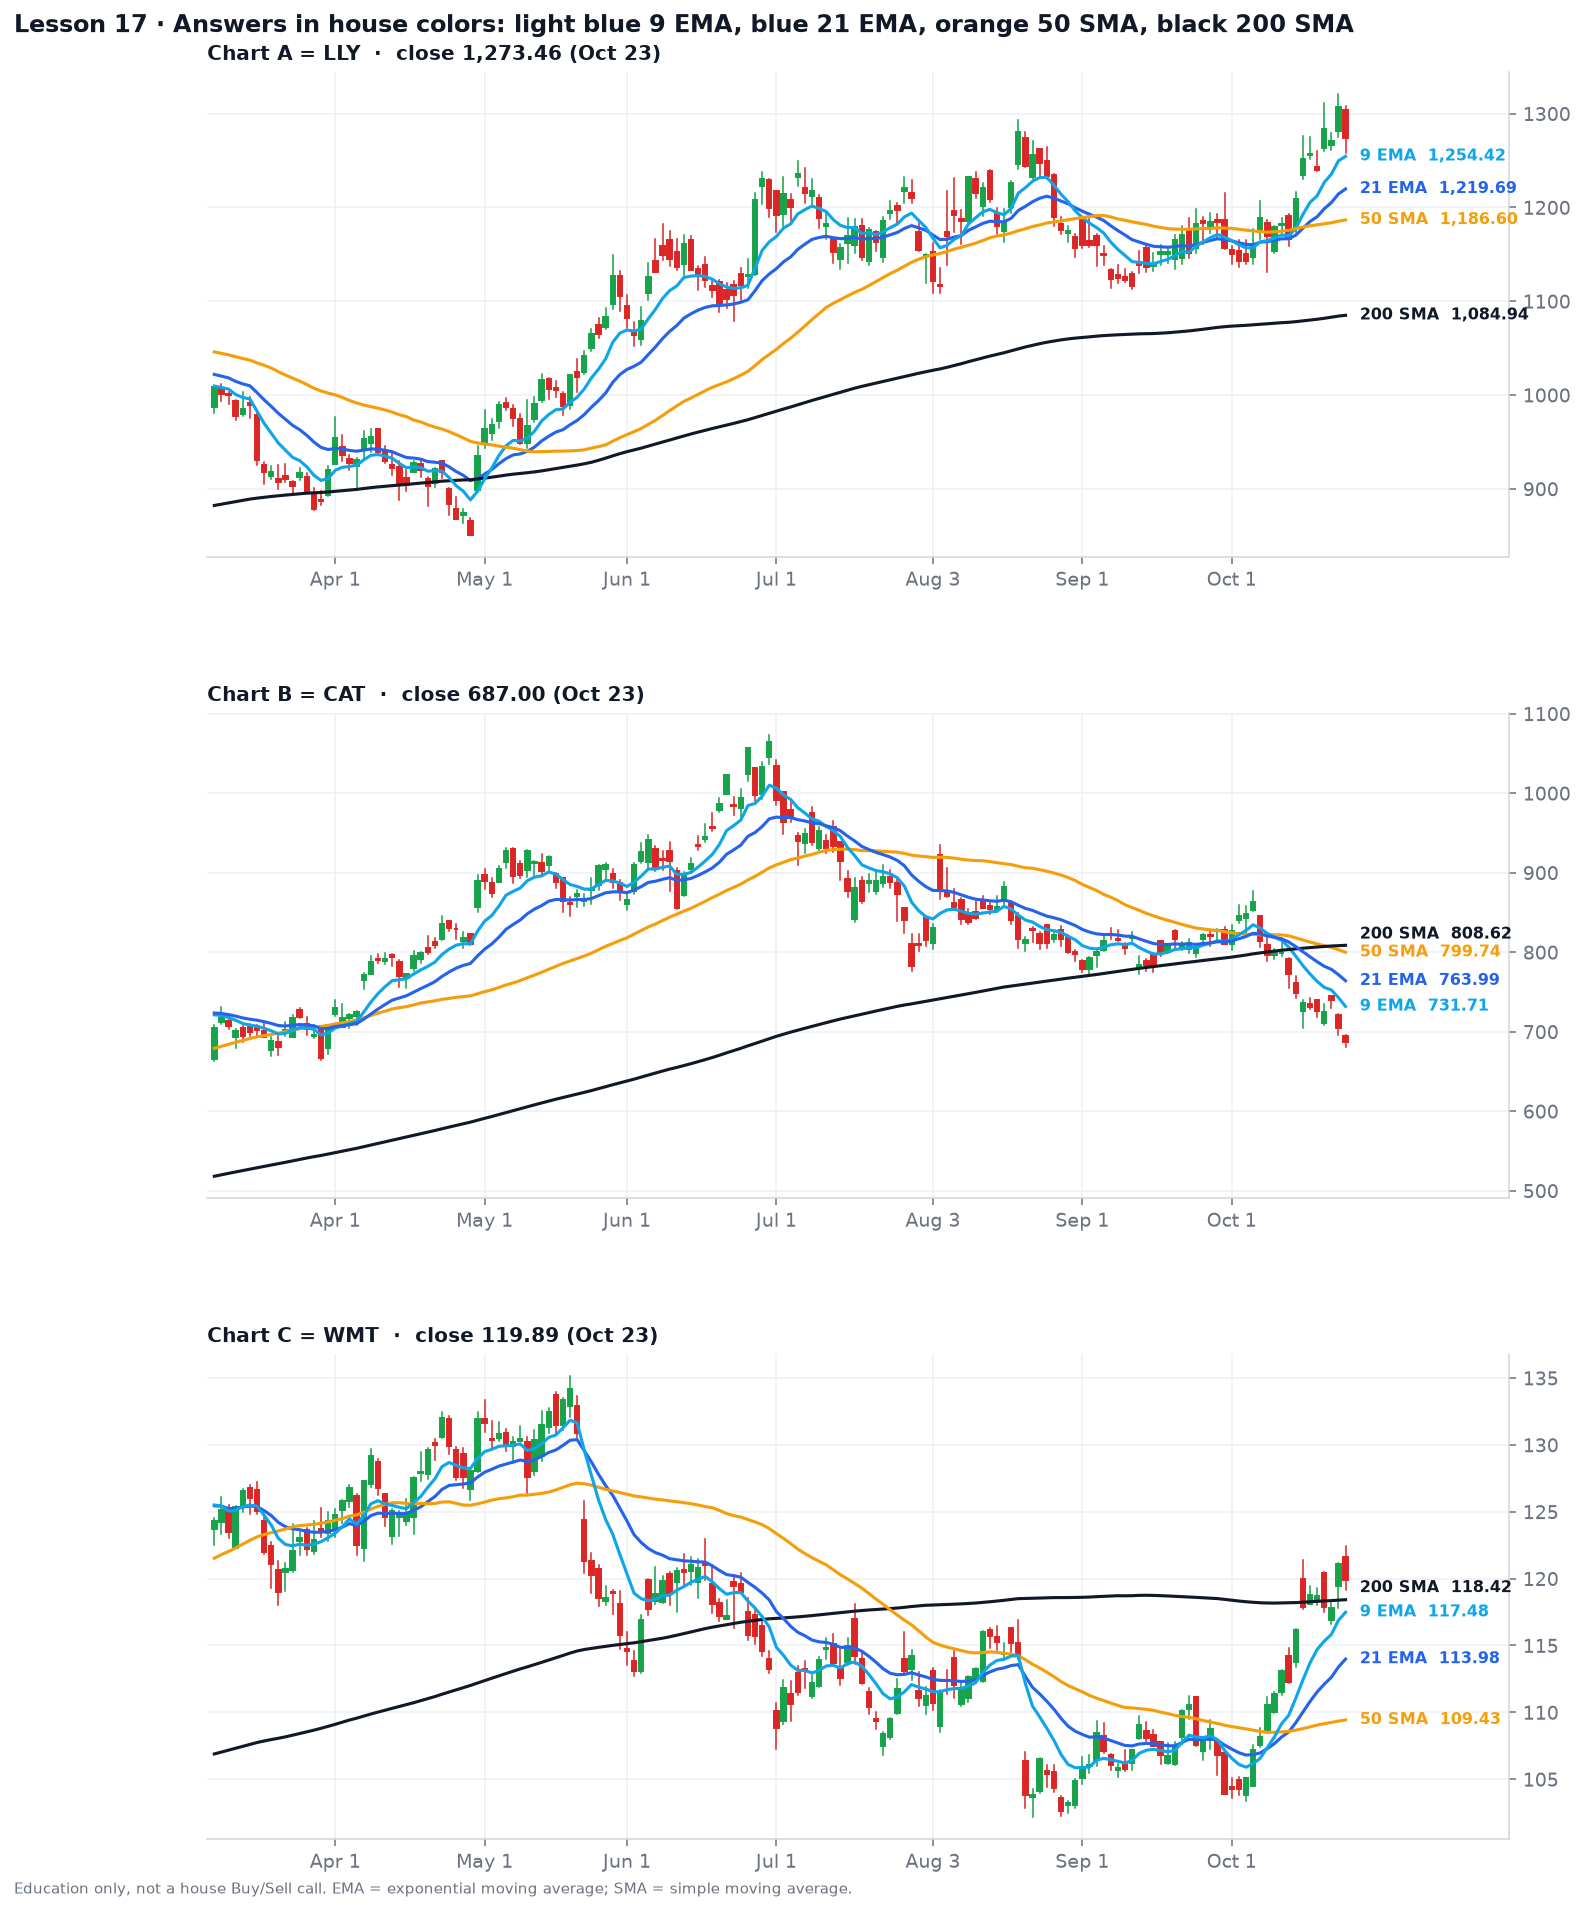
- Chart A is LLY: Line 1 = 21 EMA, Line 2 = 200 SMA, Line 3 = 9 EMA, Line 4 = 50 SMA. A clean bullish stack. On Oct 23 it closed at $1,273.46, above the 9 EMA ($1,254.42), the 21 EMA ($1,219.69), the 50 SMA ($1,186.60) and the 200 SMA ($1,084.94), and all four lines are rising. The 200 SMA is the easy one: a gentle, steady upslope far below price. LLY last closed under it on Apr 29–30 (low $850.51), and it hasn’t been back since. Notice the September chop: the 9 and 21 sank down onto the 50 and tangled with it, then price reclaimed the 21 EMA and 50 SMA on Oct 14 and the stack fanned back open.
- Chart B is CAT: Line 1 = 50 SMA, Line 2 = 9 EMA, Line 3 = 200 SMA, Line 4 = 21 EMA. The bearish version, but not fully. Price ($687.00) is under the 9 EMA ($731.71), the 21 EMA ($763.99), the 50 SMA ($799.74) and the 200 SMA ($808.62), and the three faster lines all point down. It lost the 21 EMA and 50 SMA on Oct 7 and the 200 SMA on Oct 8. On Oct 21 the 50 SMA crossed under the 200 SMA (a “death cross”). But the 200 SMA itself is still rising: it was up $19 over the last 20 sessions. That’s because it still includes the spring rally toward the $1,073.46 high on Jun 30. The fast lines say the trend broke weeks ago; the slow line hasn’t caught up yet.
- Chart C is WMT: Line 1 = 200 SMA, Line 2 = 21 EMA, Line 3 = 50 SMA, Line 4 = 9 EMA. A mixed stack, the hardest one to read. The 9 EMA ($117.48) is above the 21 EMA ($113.98), which is above the 50 SMA ($109.43), so the short-term lines are in bullish order. But the 50 SMA is still under the 200 SMA ($118.42), as it has been since Jul 24, and both slow lines are flat. Price ($119.89) only closed back over the 200 SMA on Oct 22, after bottoming at $102.15 on Aug 21. This is a repair in progress, not a confirmed uptrend.
What to notice
- Order is the fastest read. When the lines stack in order of speed with clear space between them, as on LLY, the trend is healthy. When they tangle, the trend is pausing or turning.
- The fast lines flip first and the slow lines confirm last. CAT’s 9 EMA started falling weeks before its 50 SMA crossed the 200 SMA. By the time the death cross printed on Oct 21, price was already about $120 below the 200 SMA.
- A flat 200 SMA, like WMT’s, means the long-term trend is undecided. Crossing above a flat line is a much weaker signal than crossing above a rising one (Lesson 23 covers slope).
Common mistake
Treating “price above the 200” as the whole story. WMT is above its 200 SMA right now, but its 50 SMA is still below it and both are flat. CAT’s 200 SMA is still rising even though the stock is in a sharp downtrend. Always read the whole stack and the slopes, not one line.
Try it
Open a stock you follow with all four house lines on. Before looking at the legend, guess which line is which from how much it wiggles. Then write the stack in one line, for example “price > 9 > 21 > 50 > 200, all rising.” If your stack isn’t in order, mark which line is out of place. That line is where the trend is changing.
Up next
Lesson 18 (Monday): a weekend-style review of Lessons 12–17 on one chart, with a short quiz.
Charts use real Yahoo daily data through Fri Oct 23, 2026. Part of Invest’s 90-day chart course.