EMA vs SMA: speed vs steadiness
The one idea
Both lines average the last N closes. A simple moving average (SMA) gives every one of those days the same weight. An exponential moving average (EMA) gives the most recent days more weight, so it turns sooner when price changes direction. That’s the whole trade-off: the EMA is faster but gets faked out more; the SMA is slower but steadier.
What CRM showed this fall
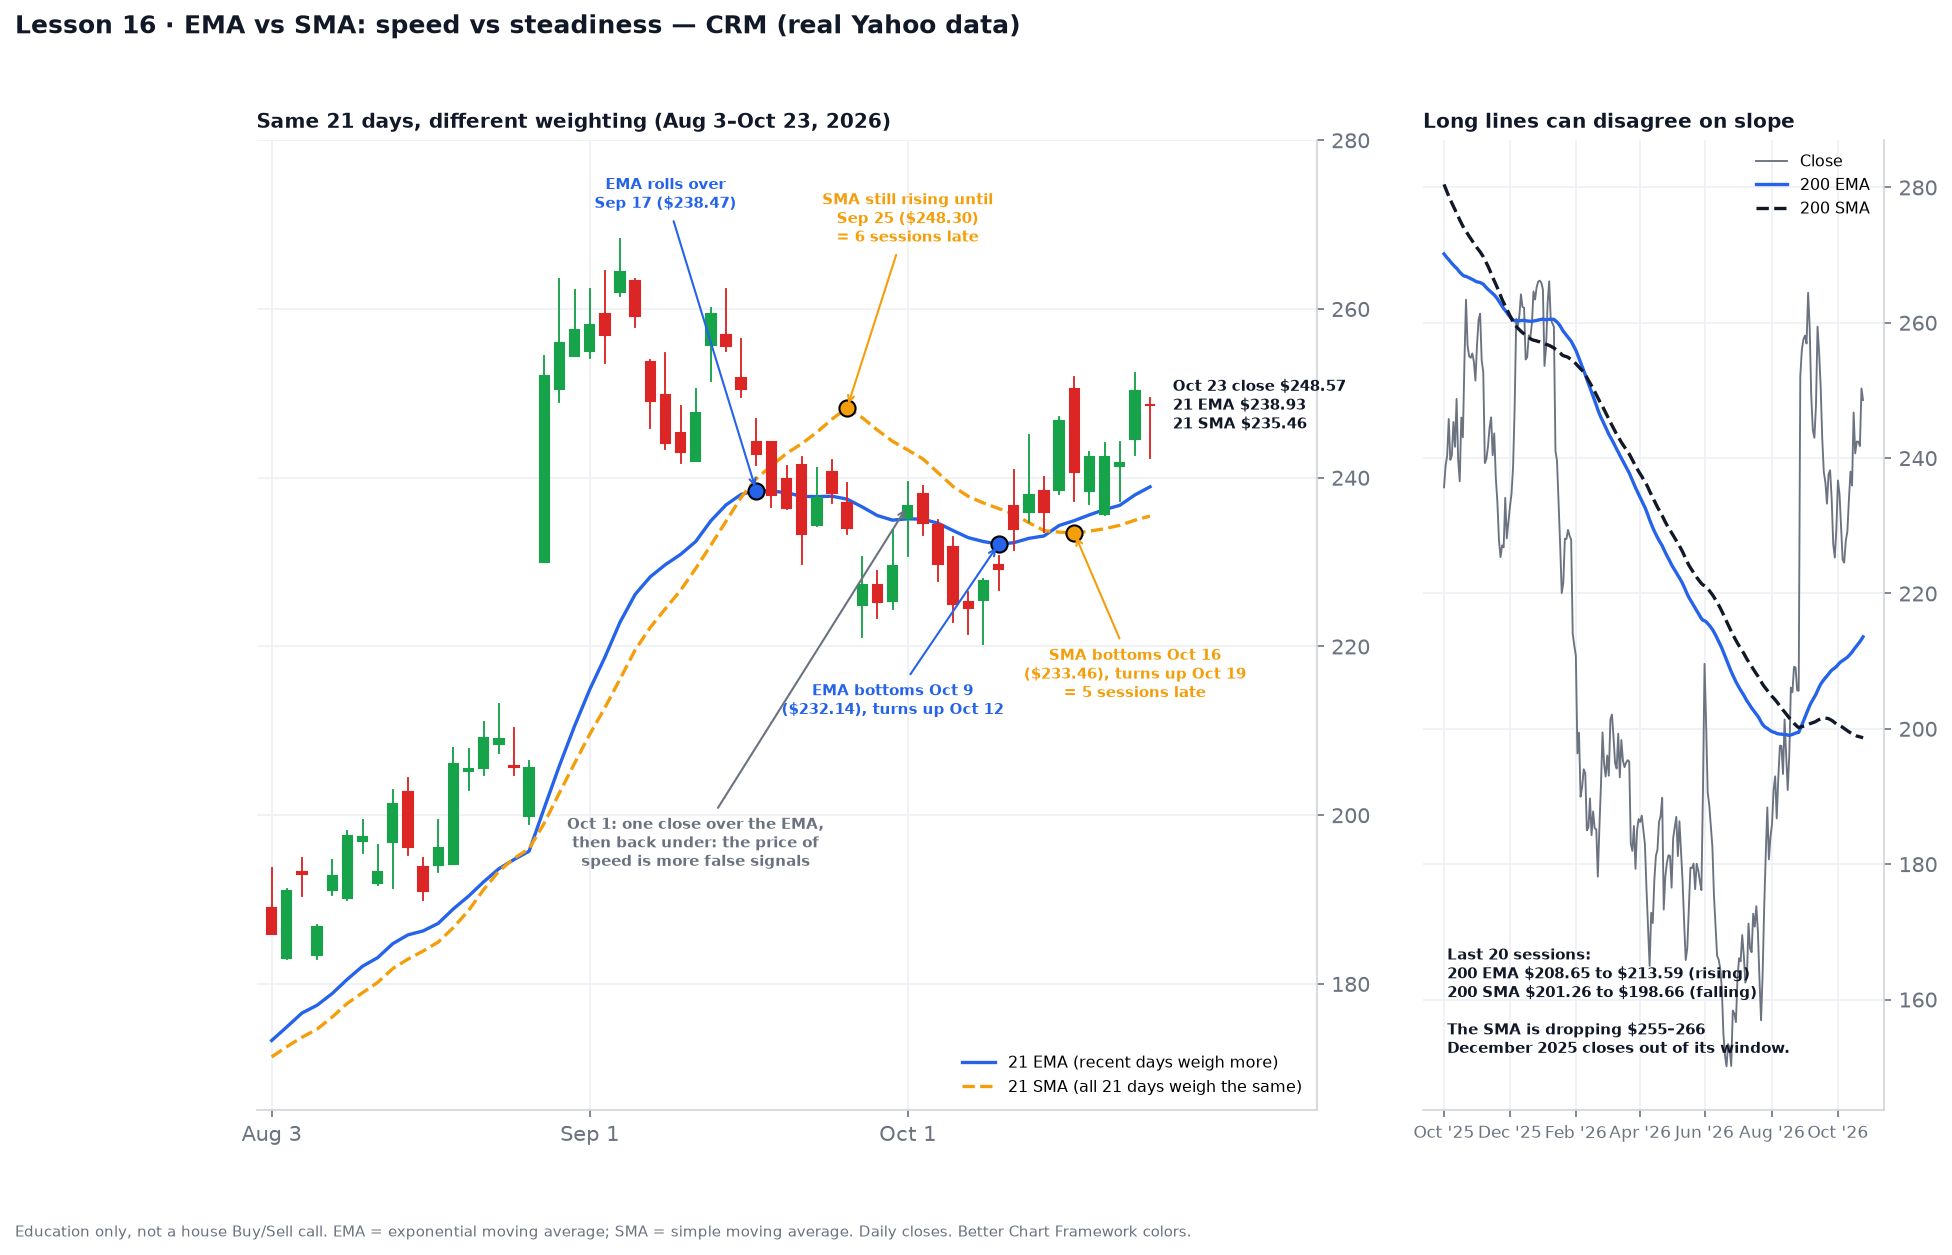
- At the top: CRM peaked near $264 in early September. The 21 EMA rolled over on Sep 17 at $238.47. The 21 SMA kept climbing for six more sessions, to $248.30 on Sep 25, even though price was already sliding. If you’d been watching only the SMA, it would have told you the trend was still up while the stock was dropping.
- At the bottom: CRM’s lowest close was $224.56 on Oct 7. The 21 EMA bottomed on Oct 9 at $232.14 and turned up on Oct 12. The 21 SMA didn’t bottom until Oct 16 ($233.46) and turned up Oct 19, five sessions later.
- The cost of speed: on Oct 1 CRM closed above the 21 EMA for one day ($236.69), then fell back under it. That’s the EMA’s weakness: it reacts to every bounce, so you get more false signals.
- Where it stands now: on Oct 23 CRM closed at $248.57, above the 21 EMA ($238.93) and the 21 SMA ($235.46), with both lines now rising.
The long lines can disagree too
The right panel is the surprise. Over the last 20 sessions CRM’s 200 EMA rose from $208.65 to $213.59, while the 200 SMA fell from $201.26 to $198.66. Same stock, same days, opposite slopes. The reason is mechanical: the 200 SMA is dropping December 2025 closes around $255–266 out of its window and replacing them with closes in the $220s–240s, so it keeps sinking. The EMA weights the recent rally more, so it already points up. When the two disagree, it’s a sign the long-term trend is in transition, not a clean call either way.
Why the house uses both
- Fast lines are EMAs: the 9 EMA and 21 EMA, because for timing you want the line that turns first. The 21 EMA is the house’s line in the sand (Lesson 20).
- Slow lines are SMAs: the 50 SMA and 200 SMA, because that’s what most institutions and screens watch, and steady lines are better for judging the big trend.
- The house scans also check the 200 EMA, so when the 200 EMA and 200 SMA disagree on slope (like CRM right now), treat the long-term trend as unsettled.
Rule of thumb
Use the EMA to decide when, and the SMA to decide whether. An entry or exit signal comes from the faster EMA. Whether you should be leaning long at all comes from the slower SMAs. And always read the slope, not just whether price is above or below the line.
Common mistake
Arguing about which one is “better.” Neither is. The mistake is mixing them up mid-trade, for example buying on an EMA signal and then ignoring the exit because the SMA still looks fine. Pick which line governs each decision before you enter.
Try it
Pull up a stock you follow and plot a 21 EMA and a 21 SMA together. Find its last clear top or bottom and count how many sessions the SMA lagged the EMA in turning. Then add the 200 EMA and 200 SMA: are they sloping the same way? If not, look back about 200 trading days to see which old prices the SMA is about to drop.
Up next
Lesson 17 (Sunday): a weekend drill, where you’ll spot the moving averages on three charts and say which line is which.
Charts use real Yahoo daily data. Part of Invest’s 90-day chart course.