Inside days & tight closes, read weekly-first
The one idea
When a stock stops swinging and starts printing small bars, it’s storing energy. An inside day is the simplest version: today’s high is below yesterday’s high and today’s low is above yesterday’s low, so the whole bar fits inside the prior one (the “mother bar”). Tight closes are the same idea over several sessions: the closes bunch up within a percent or two. Neither tells you the direction. They tell you where the move should start: a close above the mother bar’s high, or below its low.
That’s why this lesson starts on the weekly chart. The coil tells you where to look, and the weekly trend tells you which way to lean. (This also covers the multi-timeframe lesson I’d planned for yesterday’s slot, Lesson 14, which didn’t go out.)
Step 1: weekly first
- Open the weekly chart and ask one question: is the 10-week line rising, flat or falling, and is price above it?
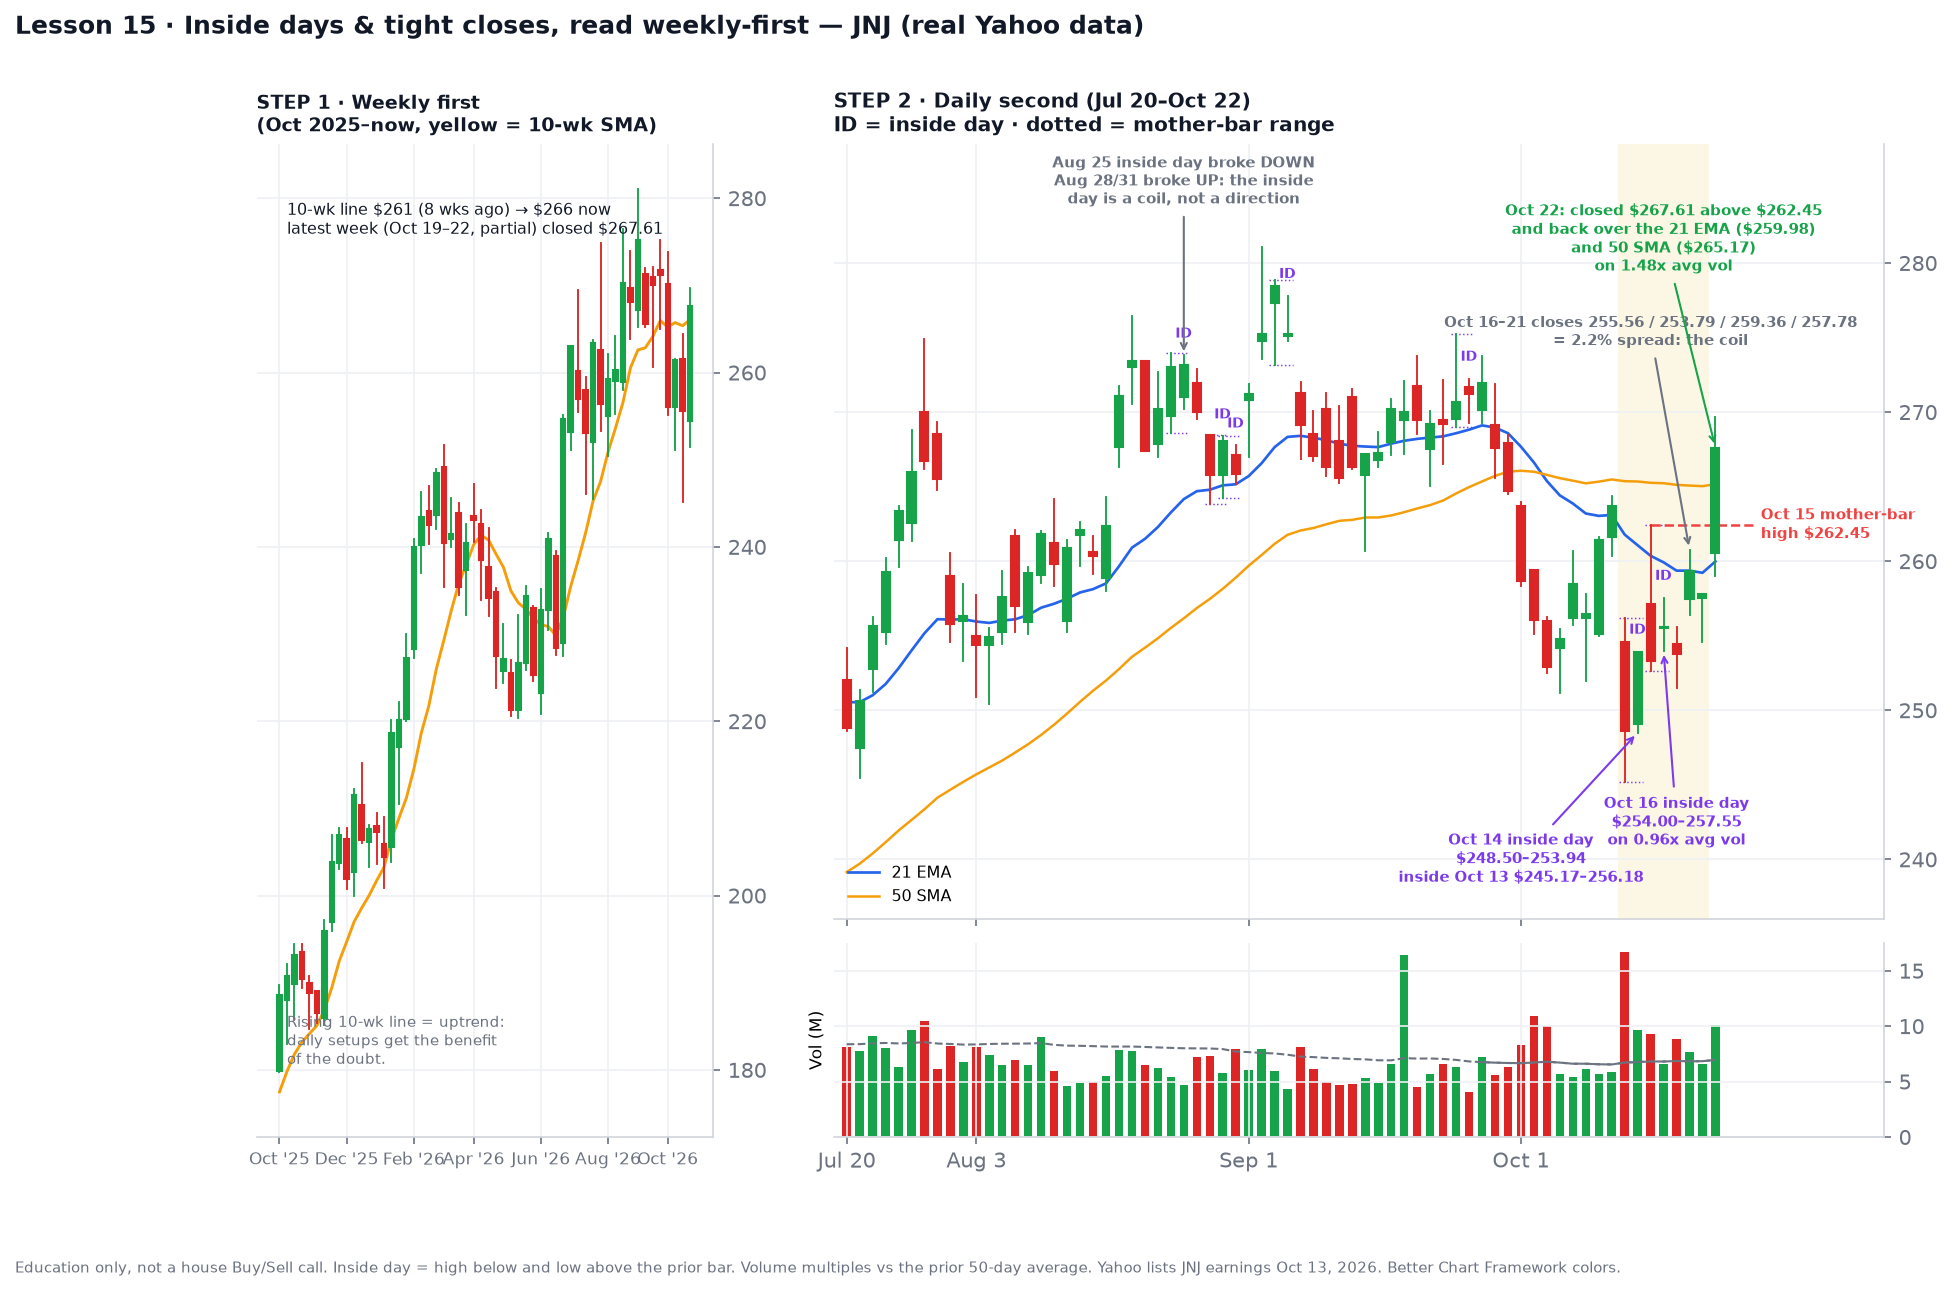
- On JNJ the weekly is a clean uptrend: from about $180 in October 2025 to a high near $281 in early September 2026. The 10-week line has risen from about $261 eight weeks ago to about $266 now, and this week (Oct 19–22, still partial) closed at $267.61, above it.
- The October dip to $245.17 was a pullback inside that uptrend, not a new downtrend. So on the daily, a coil that breaks up gets the benefit of the doubt, and one that breaks down is a warning to respect.
Step 2: daily second
- Oct 13 (earnings day per Yahoo): a wide bar from $245.17 to $256.18 on heavy volume.
- Oct 14, inside day: $248.50 to $253.94, fully inside Oct 13. Selling stopped expanding.
- Oct 15: a wide bar, $252.62 to $262.45. This is the mother bar for the next setup.
- Oct 16, inside day: $254.00 to $257.55 on 0.96× average volume, a quiet bar inside Oct 15.
- Tight closes, Oct 16–21: $255.56, $253.79, $259.36, $257.78, about a 2.2% spread. Not textbook-tight, but it’s the coil.
- Oct 22, the resolution: JNJ closed at $267.61, above the $262.45 mother-bar high, back over the 21 EMA ($259.98) and the 50 SMA ($265.17), on 1.48× its 50-day average volume. The coil broke in the direction the weekly was already pointing.
The coil is not the signal
Look at late August on the same chart. The Aug 25 inside day broke down within two days. The Aug 28 and Aug 31 inside days broke up on Sep 1. JNJ printed 15 inside days since May, and they went both ways. The inside day only tells you where to put the trigger, the mother bar’s high for a long and its low for the stop, so your risk is small and defined.
Rule of thumb
Weekly first, daily second. If the weekly trend is up, an inside day or a run of tight closes near the 21 EMA is a place to set an alert just above the mother-bar high, act only on a close through it on above-average volume, and keep the stop under the mother-bar low. If the weekly is falling, skip the long setups no matter how neat the daily coil looks.
Common mistake
Treating an inside day as bullish by itself and buying it before it breaks. The other mistake is reading the daily in isolation: a perfect daily coil under a falling 10-week line usually resolves down.
Try it
Watch whether JNJ holds above $262.45 over the next few sessions or slips back inside the coil, since a breakout that falls back under the mother bar is a failed signal. Then pull up three stocks you follow on the weekly chart first and mark each 10-week line as rising, flat or falling. Only then switch to the daily and look for the most recent inside day. Which one has a coil that lines up with its weekly trend?
Up next
Unit 2 starts tomorrow with moving averages. Lesson 16: EMA vs SMA, and why the house uses both.
Charts use real Yahoo daily data. Part of Invest’s 90-day chart course.