Ranges vs trends (when to sit out)
The one idea
Stocks spend a lot of their time going nowhere. Lesson 1’s staircase only exists in a trend. In a range, the highs and lows stop stepping up or down and just repeat, and the tools that pay in a trend, like buying the pullback to the 21 EMA or buying a push to a new high, get chopped up. The skill isn’t a new signal. It’s recognizing which regime you’re in, and when it’s a range, either trading only its edges or sitting out until it resolves.
How to tell which one you’re in
- Swing points: a trend makes higher highs and higher lows (or the reverse). A range makes roughly equal highs and roughly equal lows.
- The 21 EMA: in a trend it slopes steadily and price stays on one side of it. In a range it goes flat and price keeps crossing it.
- Volume: ranges often come with fading interest. Breakout signals inside them are weak until volume shows up and price holds outside the box.
- Count it rather than eyeball it: how many times has the close crossed the 21 EMA in the last few months?
What to look at on MDLZ
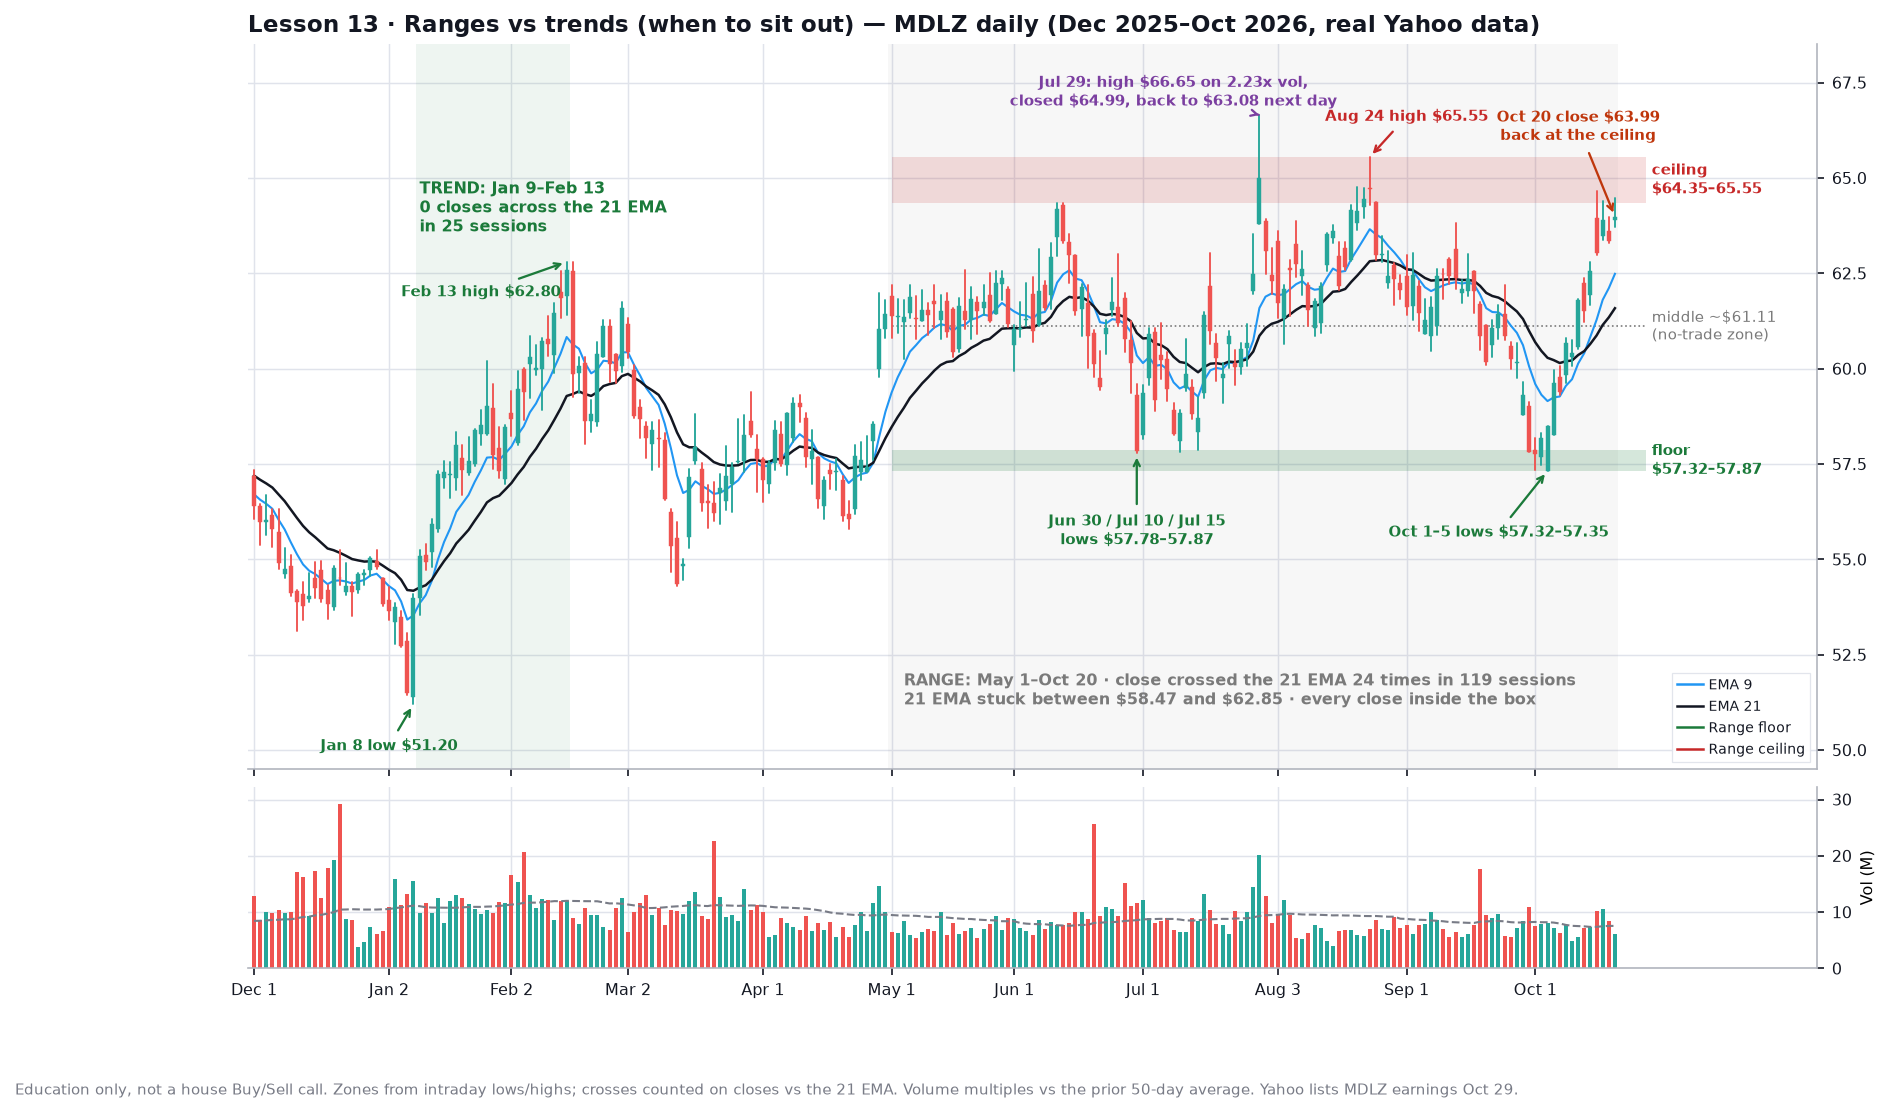
- The trend (green shading), Jan 9 to Feb 13: MDLZ ran from the Jan 8 low of $51.20 to the Feb 13 high of $62.80, about 23% in five weeks. Across those 25 sessions the close never crossed the 21 EMA once. Every dip was a buyable pullback.
- The range (grey shading), May 1 to Oct 20: over 119 sessions the close crossed the 21 EMA 24 times, about once a week. The 21 EMA itself wandered only between $58.47 and $62.85, and every single close stayed inside the box.
- The floor (green band), $57.32 to $57.87: lows of $57.78 on Jun 30, $57.82 on Jul 10, $57.87 on Jul 15, then $57.35 on Oct 1 and $57.32 on Oct 5. Five tests, all within about a percent of each other.
- The ceiling (red band), $64.35 to $65.55: highs of $64.35 on Jun 10 and 11, $65.55 on Aug 24 and $64.67 on Oct 15. On Jul 29 MDLZ spiked to $66.65 on 2.23× its 50-day average volume but closed at $64.99, inside the band, and was back at $63.08 the next day. A breakout that can’t close above the box is just a wick.
- Fading interest: the 50-day average volume slid from about 12.0M shares in mid-February to about 9.5M on May 1 and about 7.6M now.
- Now: MDLZ closed at $63.99 on Oct 20, back at the ceiling after bouncing off the floor in early October. The middle of the box, about $61.11, is the worst place to act: equal distance to either edge, no edge in your favor.
Rule of thumb
In a range, the middle is a no-trade zone. If you trade a range at all, buy near a tested floor with a stop just under it, and take profits near the ceiling instead of hoping for a breakout. Better still for a trend trader: put an alert just above the ceiling and wait for a close outside the box on volume above average, then a hold. Sitting out is a position. Cash costs you nothing while the stock goes sideways, and it keeps your attention free for names that are actually trending.
Common mistake
Using trend tools inside a range. Buying MDLZ every time it reclaimed its 21 EMA since May would have meant two dozen signals, most of which reversed within days. The other mistake is chasing the first poke through the ceiling, like Jul 29, before a close confirms it.
Try it
Yahoo lists MDLZ earnings on Oct 29, a likely moment for the box to resolve. Watch whether MDLZ closes above $65.55 on strong volume and holds there, or turns back down from the ceiling again. Then take three stocks you follow and count how many times each one’s close crossed its 21 EMA over the last three months. Which one is trending, and which one should you be ignoring for now?
Up next
Lesson 14: a quick quiz, then multi-timeframe reading (weekly chart first, daily second).
Charts use real Yahoo daily data. Part of Invest’s 90-day chart course.