Trendlines & channels done right
The one idea
A trendline is just Lesson 1’s staircase with a ruler laid across it. In an uptrend you connect rising lows; in a downtrend you connect falling highs. Two points draw a line, but only a third touch that holds proves other traders are respecting it. A channel adds a parallel line on the other side, so you can see how far price normally stretches before it rests. When the line breaks, the trend has changed character. That’s a warning to stop adding and tighten up, not an automatic sign the trend has reversed.
How to draw one properly
- Use real swing lows (or highs), not random bars, and pick one method, wicks or closes, and stick with it. This chart uses the intraday lows and highs, and judges breaks on closes.
- Don’t force a line through the middle of candles. A good support line has no meaningful lows under it between its anchors; a poke of well under 1% is noise.
- Steeper lines break sooner. A line rising about 1.8% a week is describing a sprint, and sprints end.
- When a line breaks and price holds anyway, redraw from the major low. That shallower line is usually the one that matters next.
What to look at on MA
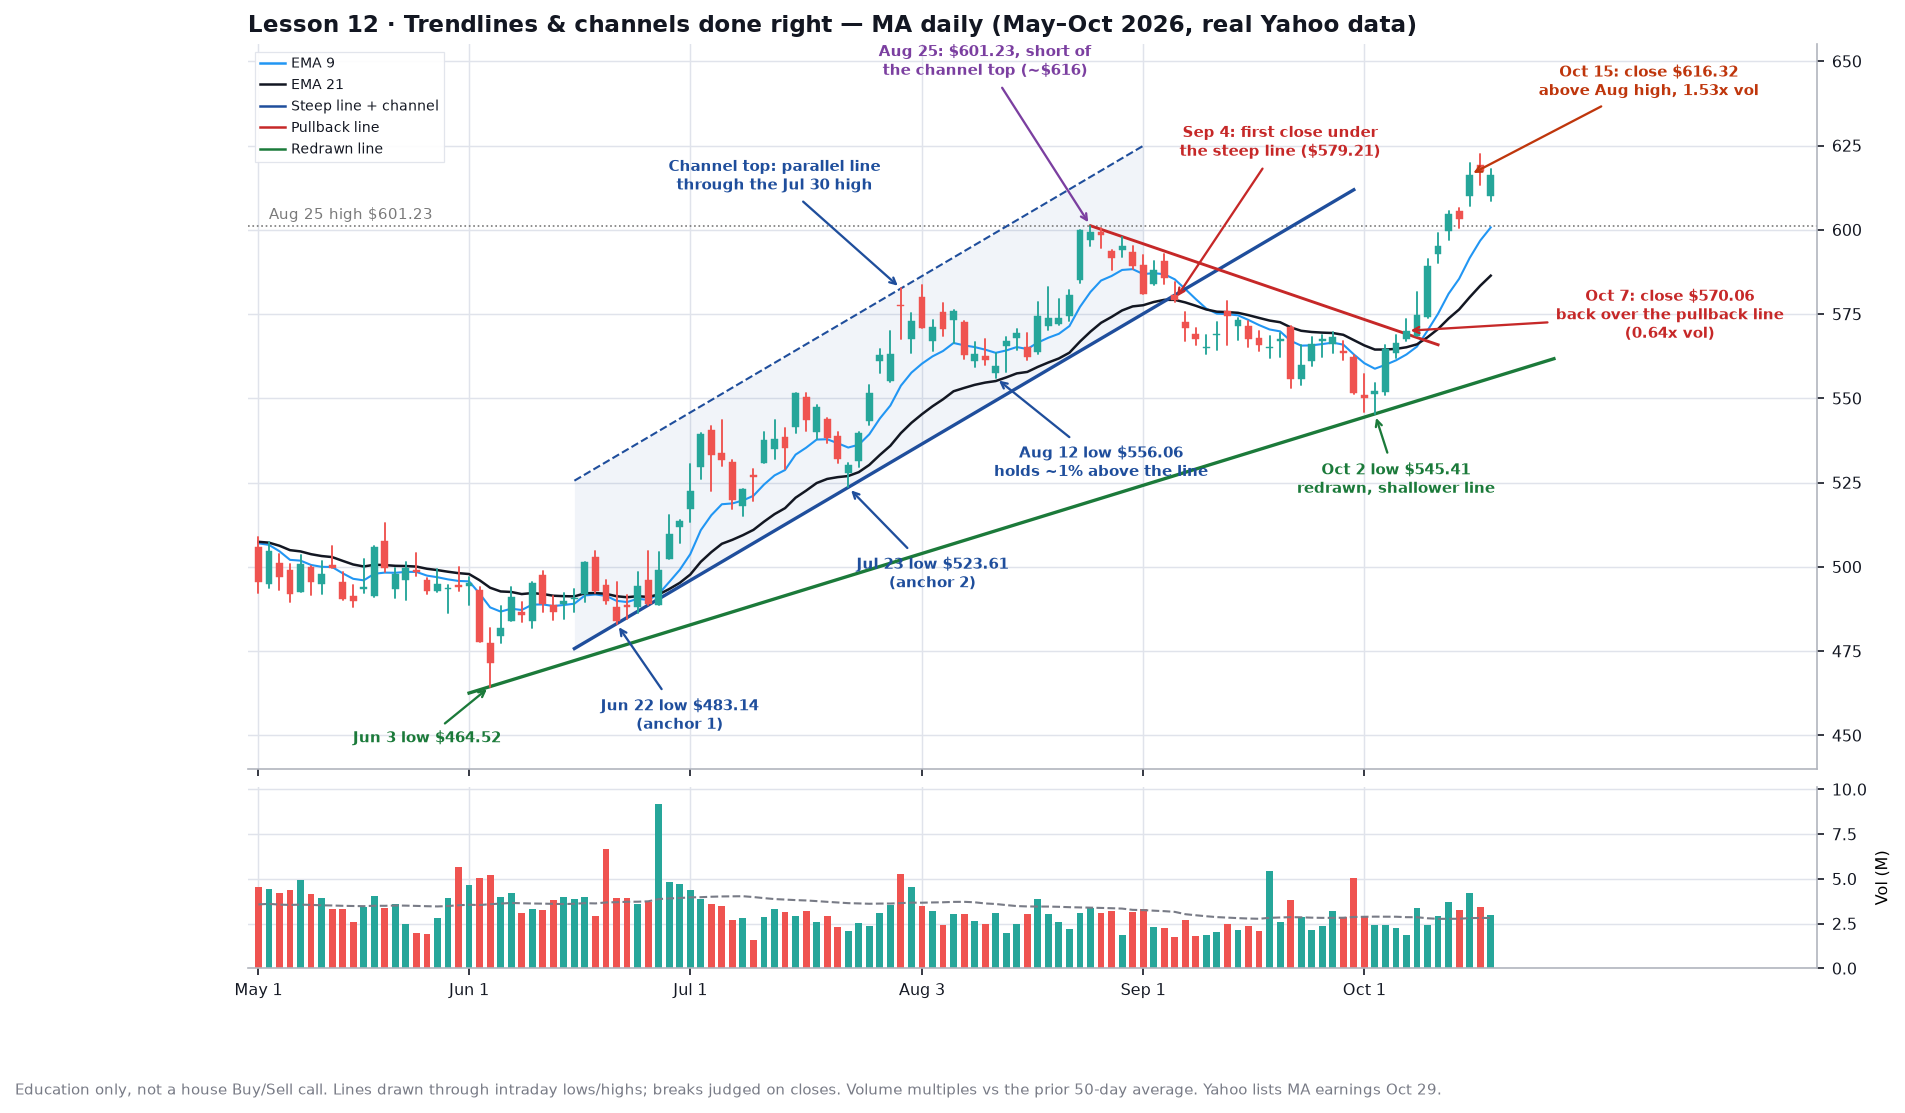
- The steep line (blue), anchored on the Jun 22 low of $483.14 and the Jul 23 low of $523.61: it rises about $1.84 a day. The Jun 23–26 bars poke under it by $0.56 to $1.92, which is noise. The Aug 12 low of $556.06 came within about 1% of the line (about $549 there) and held, so that’s the confirming third test.
- The channel top (dashed), parallel to the support line through the Jul 30 high of $582.62: healthy rallies inside a channel tend to reach the upper rail. On Aug 25 MA topped at $601.23, well short of where the rail sat by then (about $616). Failing to reach the top of a channel is an early hint that the push is tiring.
- The break, Sep 4: MA closed at $579.21, just under the line (about $580.64), on light volume, and followed through to $570.89 on Sep 8. The steep trend was over. But look at what came next: not a crash, just a sideways-to-down drift, with lows of $563.17 on Sep 10, $553.12 on Sep 22 and $545.41 on Oct 2, about 9.3% under the Aug 25 high.
- The pullback line (red): drawn across the falling highs from Aug 25 ($601.23) through Aug 28 ($598.02). MA closed back above it on Oct 7 at $570.06, but on only 0.64× its 50-day average volume, so that break alone was weak evidence.
- The redrawn line (green), from the Jun 3 low of $464.52 to the Oct 2 low of $545.41: no low between those dates falls below it, and it rises about $0.96 a day, roughly half the steep line’s pace. It’s near $556 now, with a fresh third touch still to come.
- The confirmation, Oct 15: MA closed at $616.32 on 1.53× average volume, above the Aug 25 high. That close, not the Oct 7 line break, is what said the uptrend had resumed. It closed at $616.40 on Oct 19.
Rule of thumb
Draw the line from two real swing points, then wait for the third touch to trust it. Buy interest belongs near a rising line that’s been tested, not out at the top of the channel. Treat a close under a steep line as a signal to stop adding and tighten your stop, and wait for structure to give you a new line before you act again. A trendline break alone is a weak signal; a break that also clears a prior high on volume above average, like Oct 15, carries much more weight.
Common mistake
Bending the line to fit. When price slices through, people nudge the anchor so the line still “works,” and then it tells them nothing. If a line breaks, let it break and redraw from the structure. The other mistake is selling every steep-line break as if the trend were finished. MA’s Sep 4 break led to a 9% pullback and then a new high six weeks later, not a collapse.
Try it
Yahoo lists MA earnings on Oct 29. Watch whether MA holds above the Aug 25 high ($601.23) into and after the print, and where the green line sits if it pulls back. If it drops to that line and holds, that’s the third touch. Then pick any stock you follow, draw its rising support line from two real swing lows, and add the parallel channel top. Is price nearer the bottom rail or the top?
Up next
Lesson 13: ranges vs trends, and when to sit out.
Charts use real Yahoo daily data. Part of Invest’s 90-day chart course.