Weekend review: Lessons 5–10 on one chart
Quick recap of Lessons 5–10
- Lesson 5, reversal candles in context. A candle’s shape means nothing alone. A hammer at support after a decline is a possible turn; the same shape after a run-up is a warning.
- Lesson 6, gaps. A breakaway gap leaves a base on heavy volume and often never fills. A gap down on heavy volume leaves an overhead zone that sellers defend.
- Lesson 7, support and resistance. Levels are zones built from several touches, not lines through one wick.
- Lesson 8, role reversal. A broken floor tends to become a ceiling, and a cleared ceiling tends to become a floor.
- Lesson 9, round numbers and prior highs. Prices like $100 attract stalls, and the first close through one is the tell.
- Lesson 10, spotting S/R. Find the ceiling, the floor, and where price sits now between them.
Review walkthrough: CSCO
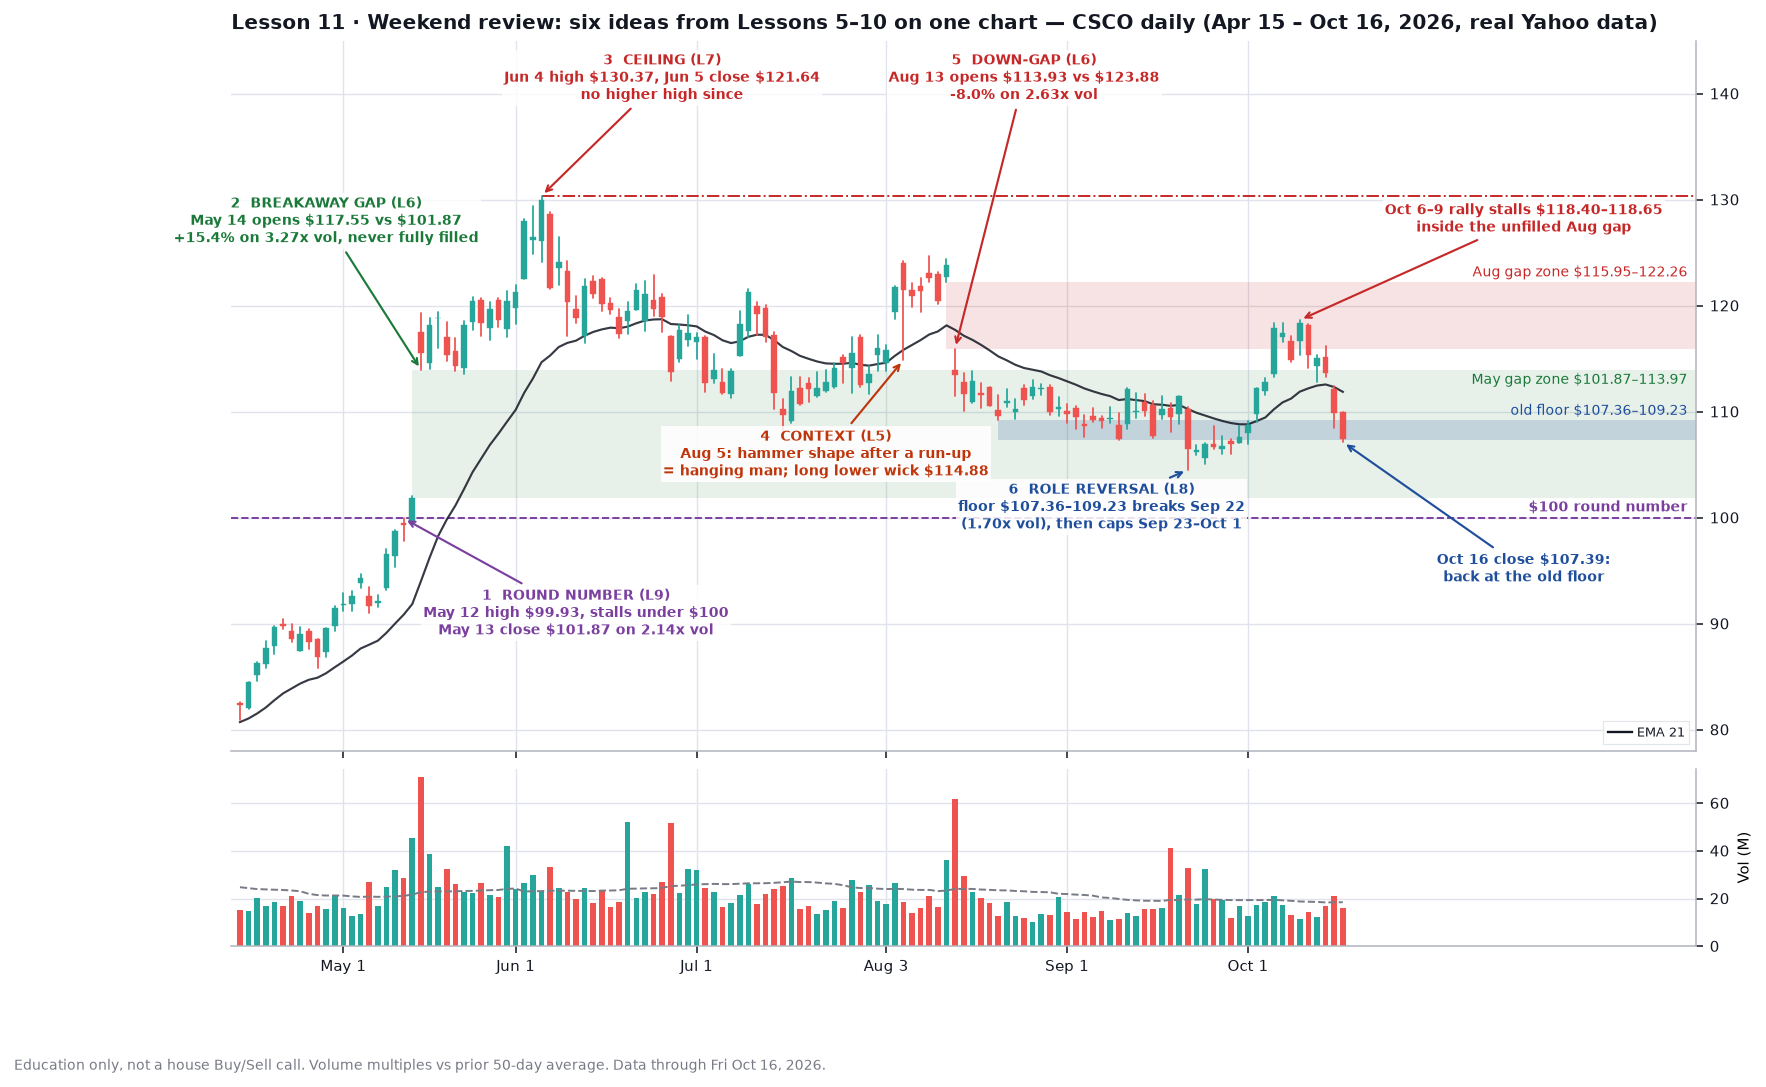
- Round number. On May 12 CSCO traded up to $99.93 and closed at $99.29, stalling a few cents under $100. The next day it closed at $101.87 on 2.14x its 50-day average volume. That first close above the round number was the tell.
- Breakaway gap. On May 14 it opened at $117.55 against the prior close of $101.87, a 15.4% gap, on 3.27x volume. The gap zone runs from $101.87 to $113.97. The deepest pullback since was $104.51 on Sep 22, so it has never fully filled.
- Ceiling. The high was $130.37 on Jun 4. The next day it closed at $121.64, and there’s been no higher high since.
- Context beats shape. On Aug 5 it opened at $124.00, dipped to $114.88 and closed at $121.50. That’s a hammer shape, a long lower wick and a small body, but it came after a run-up from about $112, so it’s read as a hanging man (a warning, not a buy signal). The warning didn’t pay off right away, since Aug 10 made a slightly higher high at $124.71, but the drop came on Aug 13.
- Down-gap as a ceiling. On Aug 13 it opened at $113.93 against the prior close of $123.88, an 8.0% gap down, on 2.63x volume. That left an unfilled zone from $115.95 to $122.26. The Oct 6–9 rally stalled at $118.40–118.65, right inside it.
- Role reversal. From Aug 20 to Sep 18, dips kept holding at $107.36–109.23. On Sep 22 it broke through, falling to $104.51 on 1.70x volume and closing at $106.44. For the next seven sessions (Sep 23–Oct 1) every high stayed at or under $109.08, so the old floor had become a ceiling. Oct 2 closed back above it at $112.20.
Friday’s close was $107.39, right back at that same old floor, with the Aug gap overhead and the 21 EMA turning down above it.
Quiz
Answer from the chart before you read the answers.
- Q1. Why was May 13’s close more important than May 12’s high?
- Q2. Which clues tell you May 14 was a breakaway gap, not an exhaustion gap?
- Q3. Aug 5 looks like a hammer. Why isn’t it a buy signal?
- Q4. What did the $107.36–109.23 zone do before Sep 22, and what did it do after?
- Q5. If $107.36 gives way again, where are the next levels on this chart?
Answers
- A1. A wick near $100 just shows the level is being tested. The close at $101.87, on 2.14x volume, shows buyers actually held the price above it.
- A2. It came off a base, ran on 3.27x volume, and the move kept going to a $130.37 high three weeks later. Its gap zone still hasn’t filled. An exhaustion gap comes late in a long move and fills within days.
- A3. Context. A hammer means something at support after a decline. Aug 5 came after a run-up, near the top of a range, so the long lower wick showed selling that buyers only partly absorbed.
- A4. Before Sep 22 it was a floor that held six dips. After the break it capped every high from Sep 23 to Oct 1. That’s role reversal.
- A5. The Sep 22 low at $104.51 comes first, then the bottom of the May gap at $101.87, with the $100 round number right under it.
Common mistake
Treating every hammer as bullish. The shape is the same on Aug 5 as it would be at a bottom; only the location changes the meaning. Always ask where the candle sits (after a rise or a fall, at support or at resistance) before you name it.
Try it
This week, watch CSCO at $107.36–109.23. Write down your guess before Friday: does the old floor hold again, or does it break toward $104.51? Then check last week’s homework: are HD, SBUX and HON stalling at their old floors from Lesson 10?
Up next
Lesson 12: trendlines and channels done right.
Charts use real Yahoo daily data through Fri Oct 16, 2026. Volume multiples are versus the prior 50-day average. Part of Invest’s 90-day chart course.