Spot support & resistance (weekend drill)
How to do it
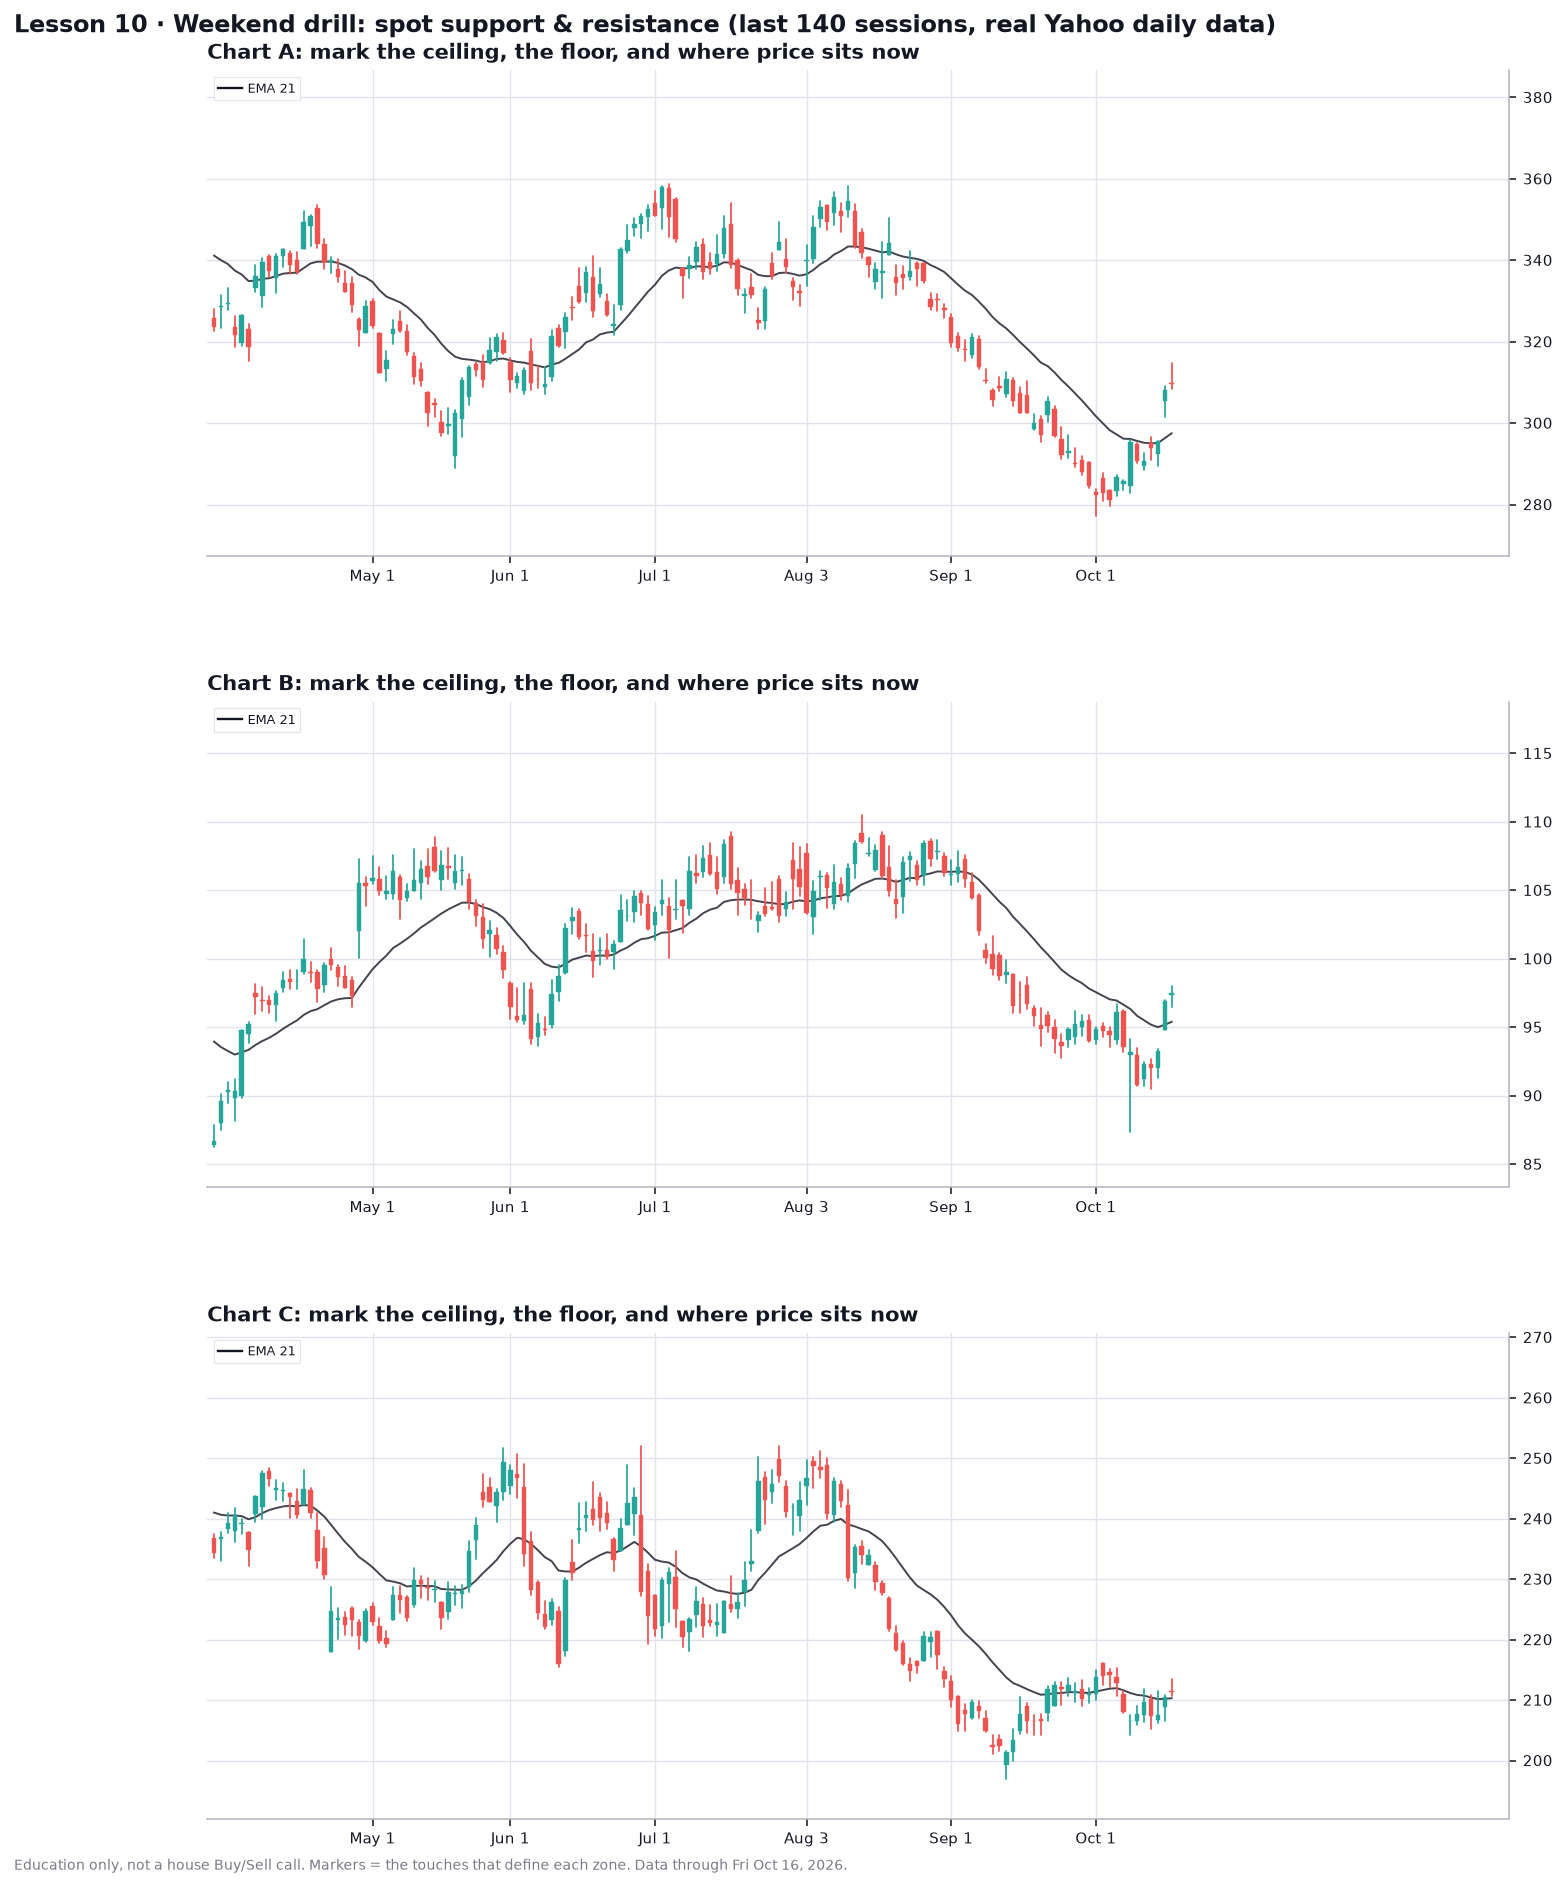
Cover the answers. On each chart, find three things: the ceiling (a price where rallies kept stalling), the floor (where dips kept getting bought), and where price sits now relative to both. Draw zones, not single lines. A level counts when price has touched it at least twice and turned.
Bonus question: on each chart, a floor has broken. What should that old floor do when price comes back up to it? (Hint: Lesson 8.)
Answers
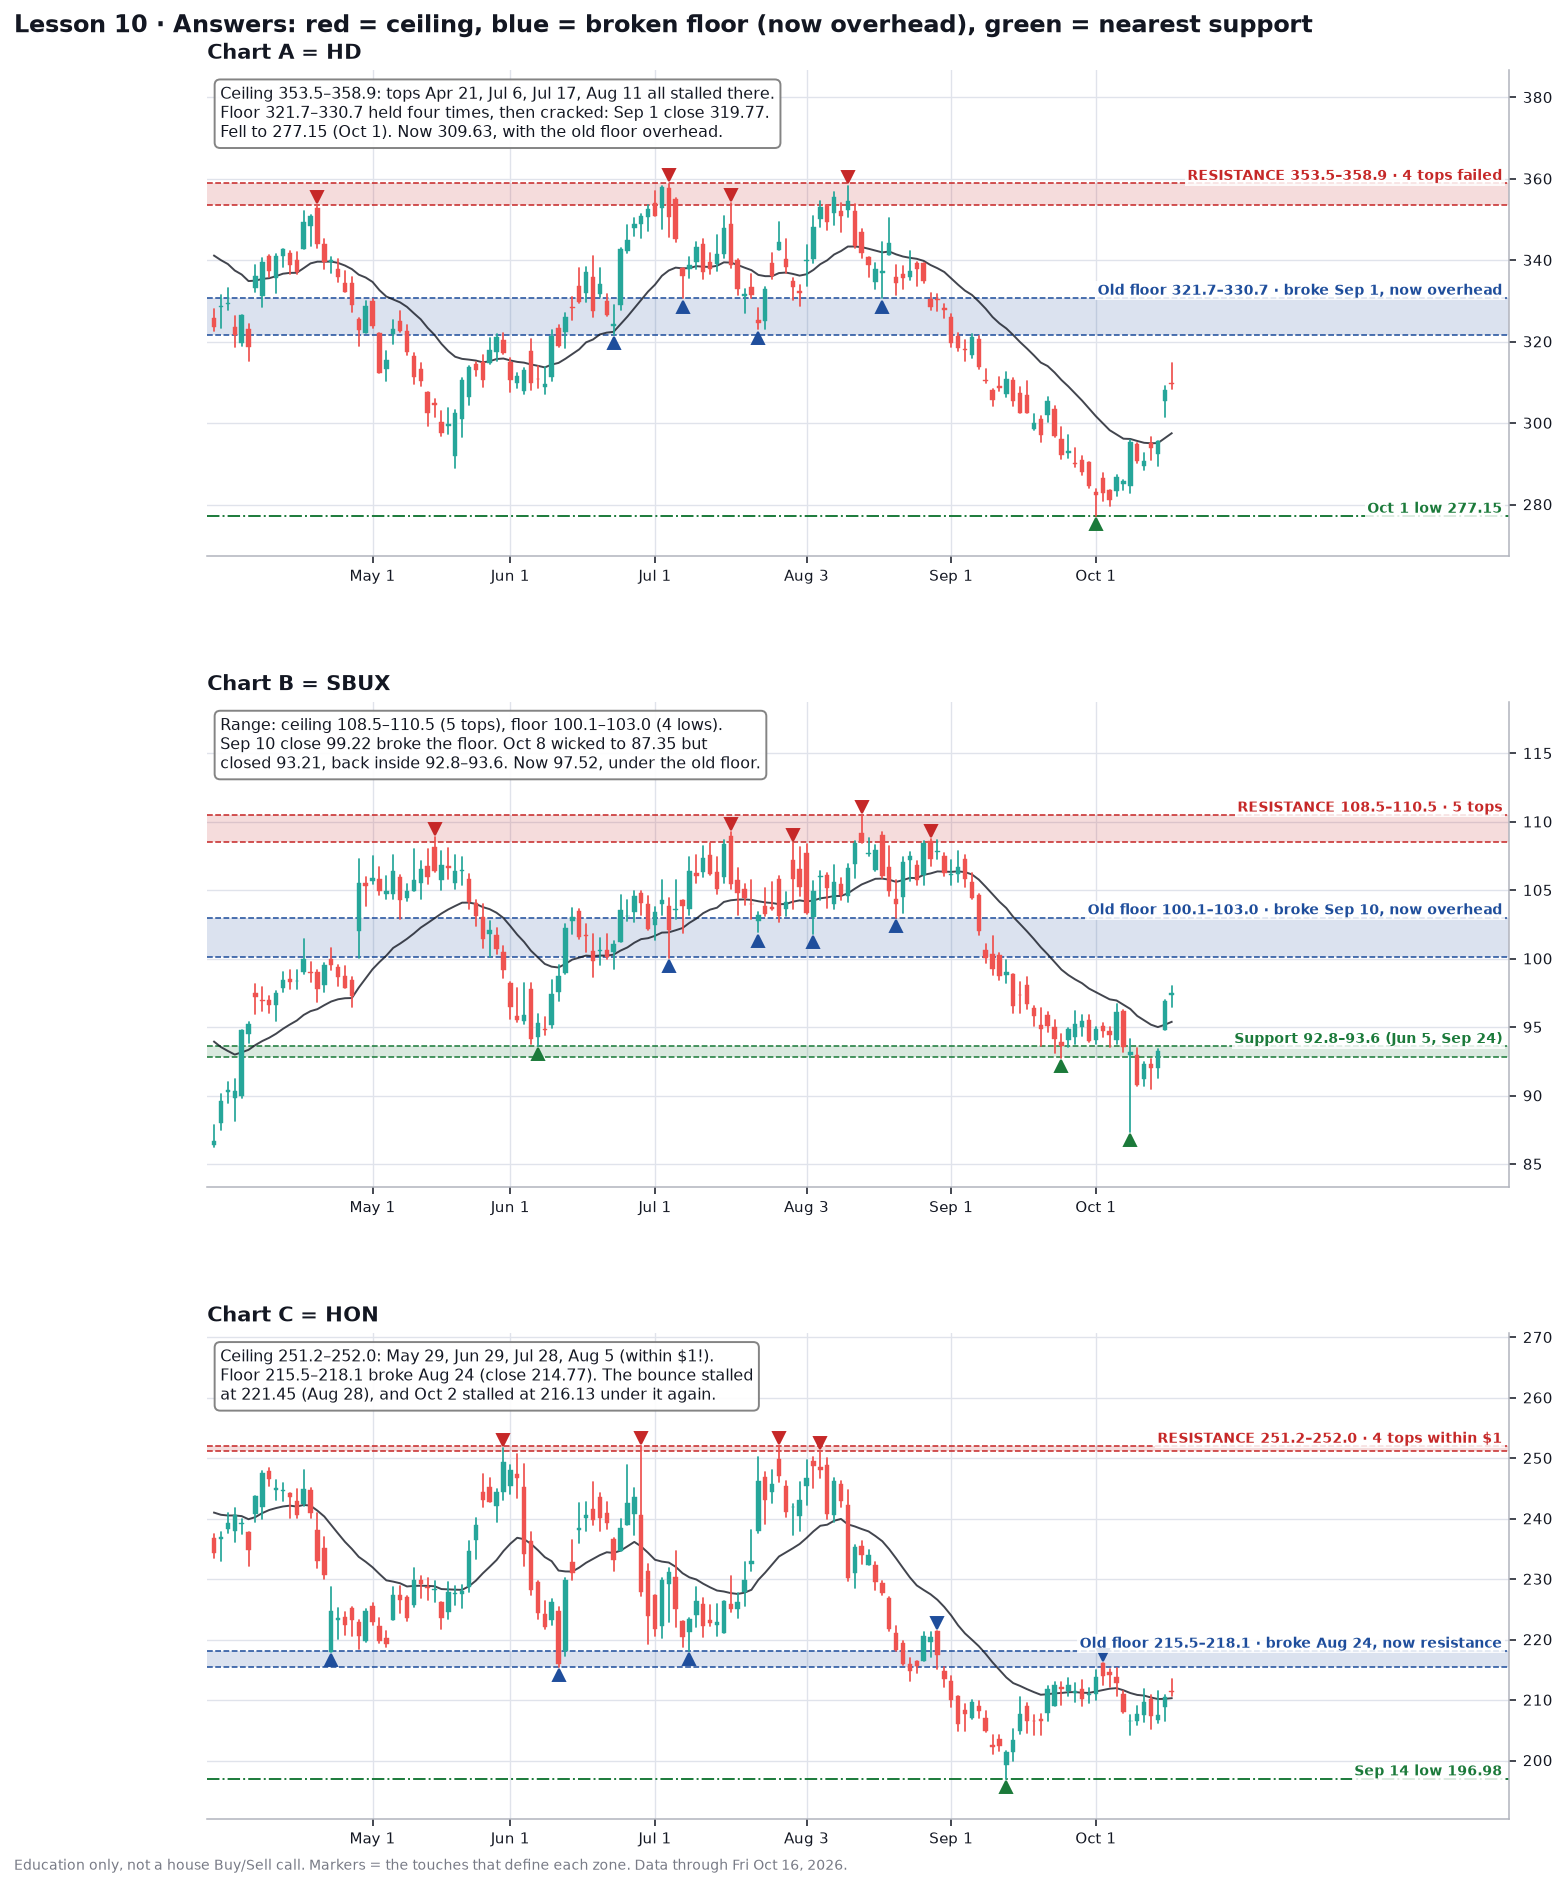
- Chart A is HD. Ceiling at $353.50–358.90: four rallies (Apr 21, Jul 6, Jul 17, Aug 11) died right there. Floor at $321.70–330.70: dips held on Jun 23, Jul 8, Jul 23 and Aug 18. On Sep 1 it closed at $319.77, below the floor, and slid to a low of $277.15 on Oct 1. It closed Friday at $309.63 after gapping up on Oct 15, so the old floor ($321.70–330.70) is now the overhead test.
- Chart B is SBUX, a textbook range that broke down. Ceiling at $108.50–110.50 (five tops: May 14, Jul 17, Jul 30, Aug 13, Aug 27). Floor at $100.10–103.00 (four lows: Jul 6, Jul 23, Aug 4, Aug 20). It closed under the floor at $99.22 on Sep 10. The next support was the Jun 5 / Sep 24 lows near $92.80–93.60. On Oct 8 it wicked all the way to $87.35 but closed at $93.21, right back in that zone, a classic false break. Friday’s close was $97.52, heading up toward the old $100–103 floor from below.
- Chart C is HON, the cleanest one. Ceiling at $251.20–252.00: May 29, Jun 29, Jul 28 and Aug 5 all topped within a dollar of each other. Floor at $215.50–218.10 (Apr 23, Jun 10, Jul 9). It closed below on Aug 24 ($214.77), bounced for three days to $221.45 on Aug 28, and failed. After the Sep 14 low of $196.98, the Oct 2 rally stalled at $216.13, right at the bottom of the old floor. That’s role reversal happening live. Friday close: $211.41.
- Bonus answer: a broken floor tends to become a ceiling. HON already showed it twice. HD and SBUX are both heading up into their old floors now, so they’re the test.
What to notice
- Every level is a zone a few dollars wide. HD’s tops ranged from $353.55 to $358.85, and SBUX’s Oct 8 wick undercut support by more than $5 before closing back inside.
- The more times a level is tested, the more it matters when it finally breaks. All three floors held three or four times before giving way, and each break led to a fast leg lower.
- Price sitting between a broken floor above and support below is no-man’s-land. That’s where all three of these are today.
Common mistake
Drawing a line through one dramatic candle. SBUX’s Oct 8 low of $87.35 was a single wick; the real support was where several bodies and lows clustered, $92.80–93.60. Mark levels from clusters of touches and closes, not from one spike.
Try it
This week, watch whether these old floors act as ceilings: HD near $321.70–330.70, SBUX near $100.10–103.00, HON near $215.50–218.10. Write down your guess for each before Friday: stall and turn down, or close back above? Bonus: mark the ceiling and floor on one stock you follow.
Up next
Tomorrow is the weekend review: a short recap of Lessons 7–10 and a few practice questions.
Charts use real Yahoo daily data through Fri Oct 16, 2026. Part of Invest’s 90-day chart course.