Round numbers & prior highs
The one idea
Round numbers ($300, $400) and prior highs are where orders pile up. People park sell targets and limit orders at round numbers, and anyone who bought near an old high and sat through the drop is happy to sell once they’re back to even. So price often stalls the first time it reaches one of these levels. When it finally closes through, that supply has been absorbed, and the level tends to flip into support, just like Lesson 8.
Why it works
- Round numbers are where humans anchor: price targets, “I’ll buy it at 300,” option strikes, and stop orders all cluster at them.
- A prior high is a memory. Everyone who bought there was underwater for months, and many sell the first time they can get out flat.
- Both levels are visible to everyone, so they work partly because everyone is watching them.
What to look at on V
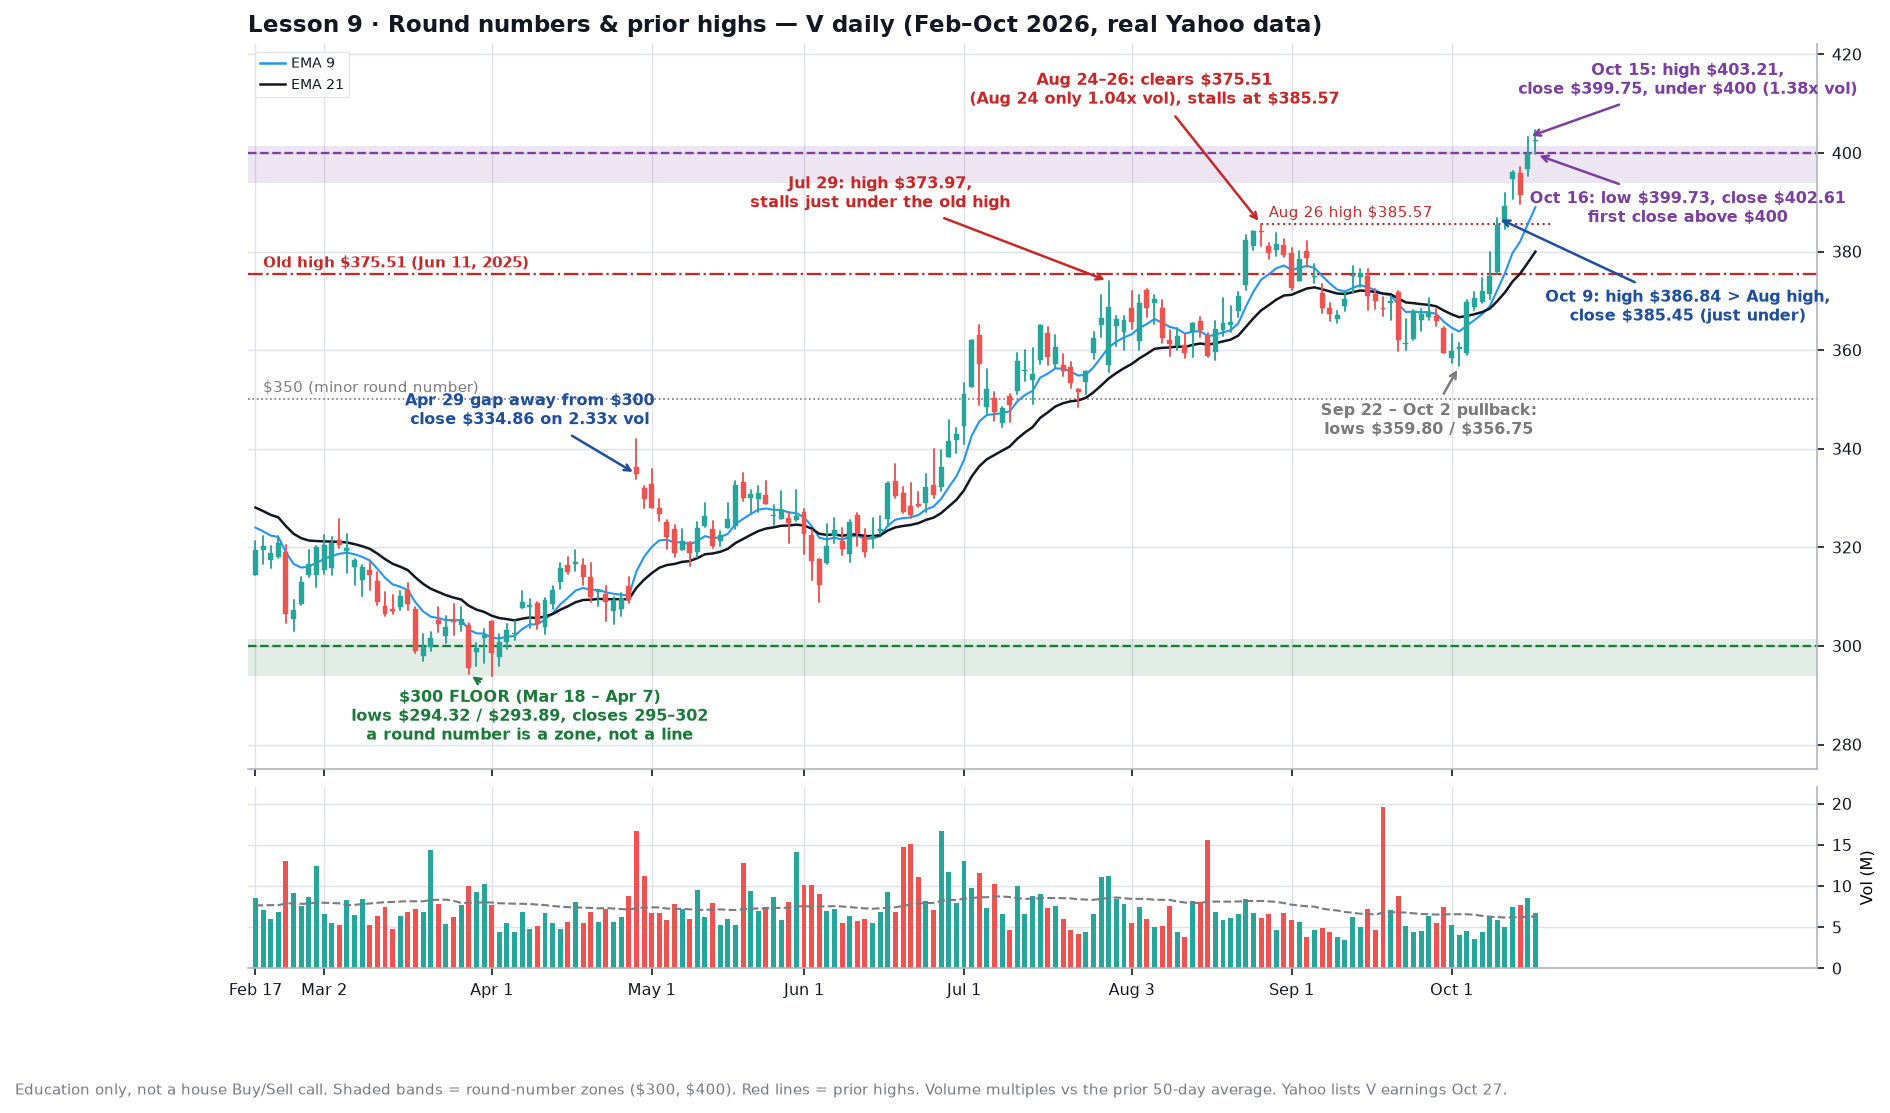
- $300 as a floor (green band), Mar 18 – Apr 7: V dipped under $300 again and again, with lows of $294.32 on Mar 27 and $293.89 on Apr 1, about 2% below the number. But the lowest close was $295.52, and it never got going lower. On Apr 29 it gapped away to close at $334.86 on 2.33× its 50-day average volume. A round number is a zone, not a line.
- The old high, $375.51 (Jun 11, 2025): on Jul 29, 2026, V reached $373.97, about $1.50 short, and closed at $368.73. It backed off to $359.42 by Aug 12. That was the old high doing its job as a ceiling.
- A weak first break, Aug 24–26: V cleared $375.51 and closed at $382.41 on Aug 24, but on only 1.04× average volume. It stalled at $385.57 on Aug 26, fell back under the old high by Sep 1 (close $372.67), and slid to a low of $356.75 on Oct 2, about 5% under it. Now there were two prior highs to deal with: $375.51 and $385.57.
- The second try, Oct 9–12: on Oct 9 V poked to $386.84, just above the Aug high, but closed at $385.45, a hair under it. Oct 12 closed at $389.27, the first close above both prior highs.
- The $400 test (purple band), Oct 15–16: on Oct 15 V traded up to $403.21 on 1.38× volume and closed at $399.75, just under the number. On Oct 16 it opened at $402.50, dipped to $399.73 (right at $400), and closed at $402.61, its first close above $400. The round number held as support on day one.
Rule of thumb
Before any trade, mark the nearest prior high and the nearest round number above and below price. Avoid buying just under them, since there’s little room before the likely stall. Wait for a close through, ideally on volume clearly above average, or for the first pullback that holds the level from above. Don’t put stops exactly on a round number like $299.95; those get poked, as V’s did in March. Put them under the whole zone. And when you’re in a winner, round numbers above you are natural places to trim.
Common mistake
Buying the first break of a prior high when volume isn’t there. V’s Aug 24 close of $382.41 looked like a breakout, but volume was ordinary, and the stock gave back about 6.7% to the Oct 2 low of $356.75 before it tried again. The close above the level matters, and the volume behind that close tells you how serious it is. Volume gets its own unit starting Lesson 31.
Try it
Yahoo lists V earnings on Oct 27. Over the next two weeks, watch the $400 zone (roughly $394–401). Does it hold on pullbacks the way $300 did in the spring, or does V close back under the Aug high of $385.57, which would say the breakout failed? Write your call down before the print. Bonus: pick any stock you follow and mark its nearest round number and prior high.
Up next
Tomorrow is a weekend drill: three charts, and you mark the support and resistance yourself before seeing the answers.
Charts use real Yahoo daily data. Part of Invest’s 90-day chart course.