Role reversal: old resistance becomes support
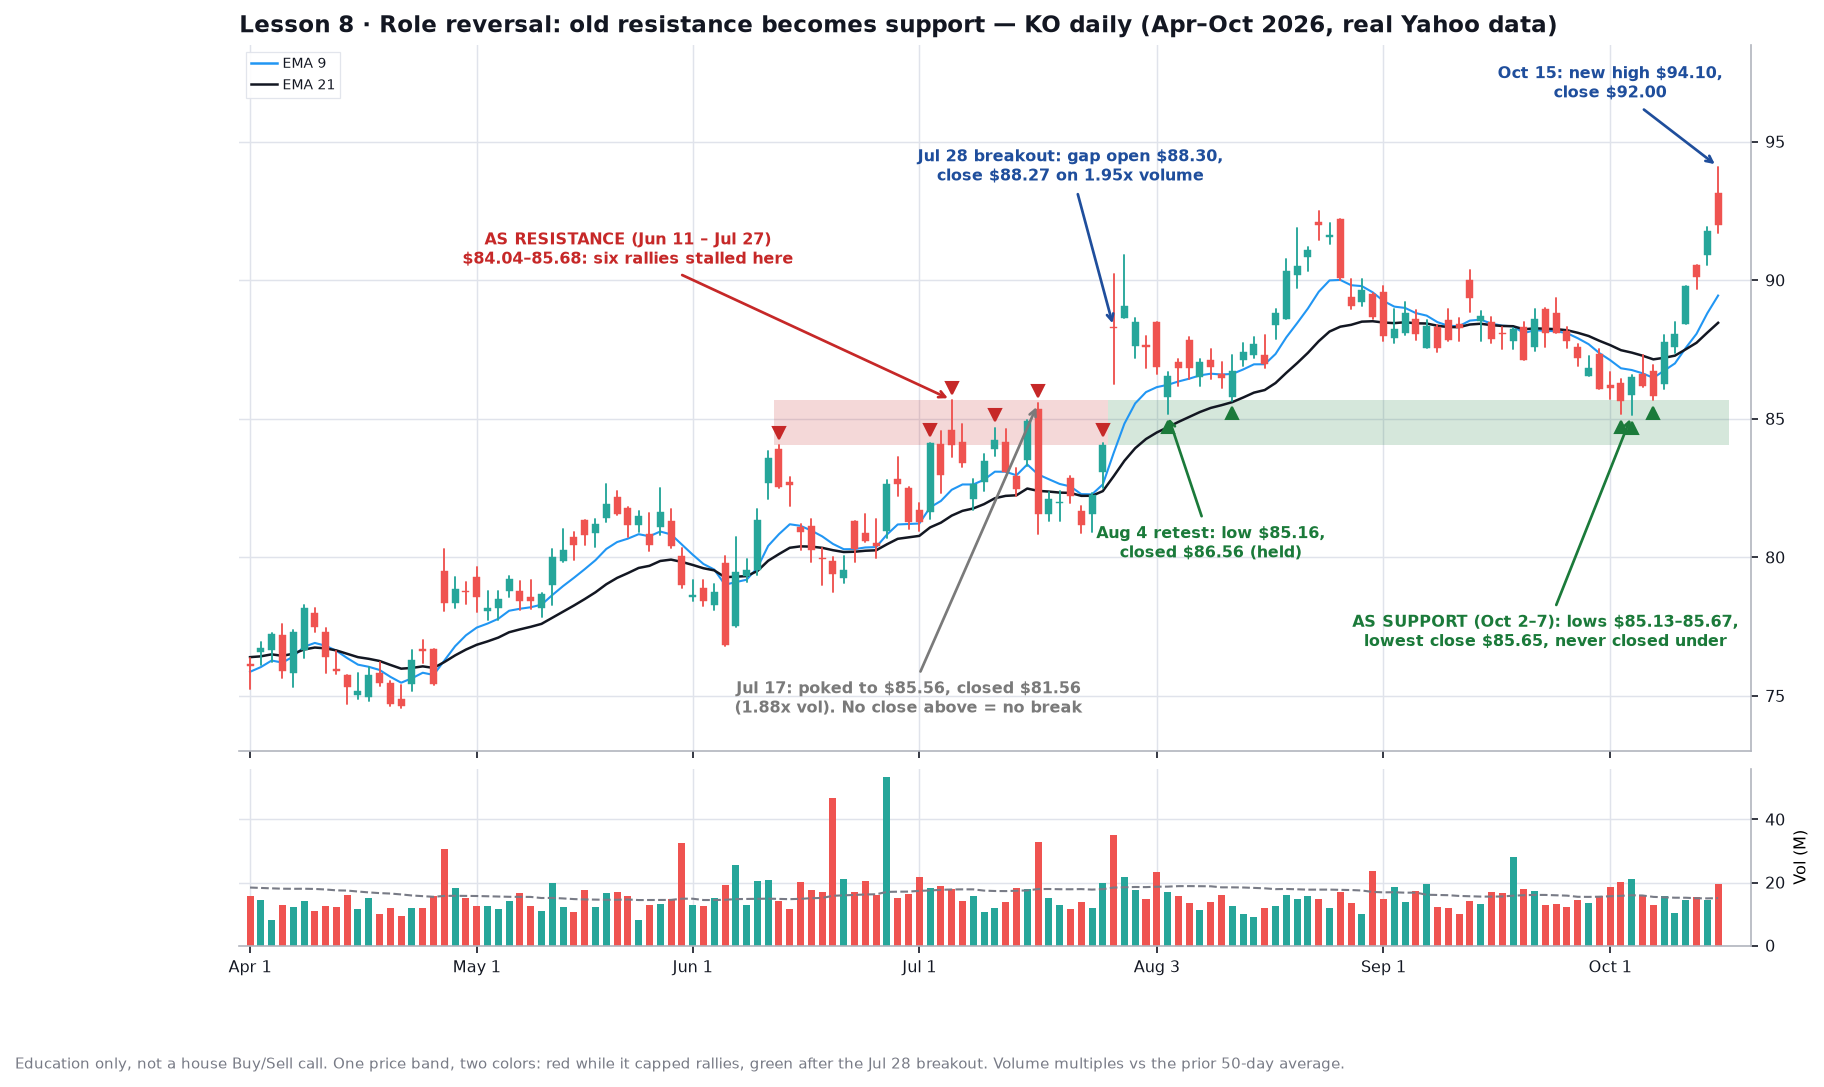
The one idea
When a stock finally closes through a ceiling and stays there, that same price area often becomes the floor on the next pullback. The level doesn’t disappear after the breakout; it changes jobs. That flip is the cleanest low-risk spot on a chart, because you know exactly where you’re wrong: a decisive close back under the zone.
Why it works
- Sellers who capped the old ceiling are used up once price clears it, so the supply that stopped every rally is gone.
- Buyers who watched the breakout without acting want a second chance at the breakout price, so they bid when it comes back.
- Traders who bought the breakout defend their entry. All three groups meet in the same band.
What to look at on KO
- The ceiling, $84.04–85.68 (red): six rallies stalled there between Jun 11 and Jul 27. The highs were $84.04 (Jun 11), $84.14 (Jul 2), $85.68 (Jul 7), $84.68 (Jul 13), $85.56 (Jul 17) and $84.14 (Jul 27).
- The breakout, Jul 28: KO gapped open at $88.30, well above the band, and closed at $88.27 on 1.95× its 50-day average volume. That’s a real break: a close clearly beyond the zone on heavy volume.
- First retest, Aug 4: it pulled back to $85.16, inside the old ceiling, and closed at $86.56. Aug 12 tagged $85.66 and closed at $86.71. Then it ran to $92.49 on Aug 24.
- Second retest, Oct 2–7 (green): lows of $85.17, $85.13 and $85.67. The lowest close was $85.65 on Oct 2; it never closed under the band. Oct 5 bounced to close at $86.51 on 1.35× volume, which is buyers showing up right where they should.
- Payoff: on Oct 15 KO traded up to a new high of $94.10 and closed at $92.00. In hindsight, a buyer at the Oct 5 close of $86.51 with a stop just under $84.04 was risking about 2.9% and was up about 6.3% by Oct 15. That’s the shape you want: small, defined risk against a proven level.
Rule of thumb
After a breakout, redraw the old ceiling as a floor and wait. The first pullback into it is usually the best one. Look for the pullback to come in on lighter volume, then a close back up off the zone. Put the stop just under the bottom of the band. If price closes decisively below the band, the flip has failed and the level is likely to act as a ceiling again, so step aside.
Common mistake
Treating an intraday poke as the breakout. On Jul 17, KO pushed up to $85.56, right at the top of the ceiling, then reversed and closed at $81.56 on 1.88× volume. Anyone who bought the poke was down nearly 5% by the close. A level only flips after a close clearly beyond it, like Jul 28. Until then, it’s still resistance.
Try it
Go back to yesterday’s PG chart. On Oct 14, PG closed above its $153–154 ceiling for the first time since March. Watch it over the next couple of weeks: if it pulls back, does $153–154 hold as a floor, or does it close back inside the old range? Yahoo lists PG earnings on Oct 22, so that print may be the test. Write down your call before it happens.
Up next
KO’s Oct 15 high of $94.10 cleared its Aug 24 high of $92.49 intraday, but it closed at $92.00, back under that prior high and just over the $90 round number. Prior highs and round numbers are Lesson 9.
Charts use real Yahoo daily data. Part of Invest’s 90-day chart course.