Quiz + support & resistance basics
Quick quiz (lessons 1–6)
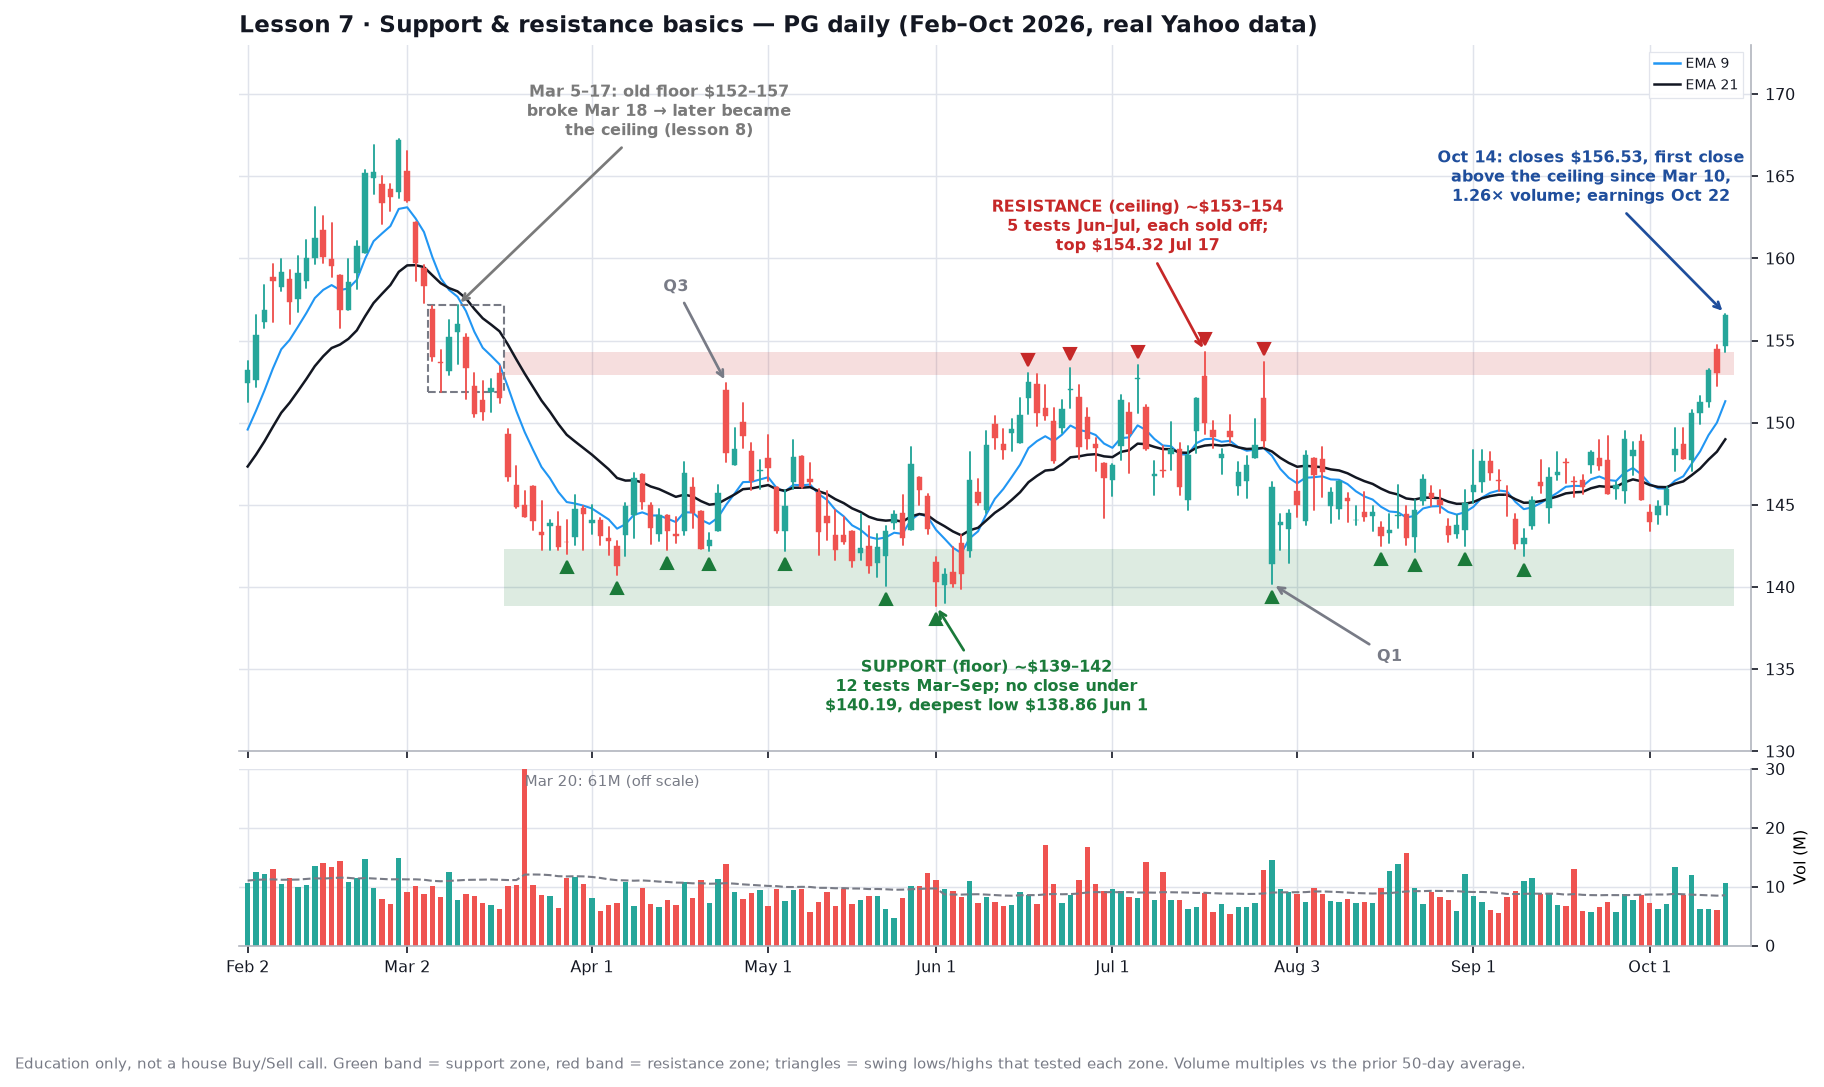
All three use the PG chart above. Answer in your head first, then open the answers.
- Q1 (candles + gaps): On Jul 29, PG opened at $141.38 after closing at $148.88 the day before. It dipped to $140.20, then closed at $146.10, near the day’s high of $146.38, on 1.65× average volume. What is that candle telling you, and why does where it happened matter?
- Q2 (trend): From Mar 18 to Oct 12, is PG in an uptrend, a downtrend, or sideways? Use the staircase test.
- Q3 (gaps): On Apr 24, PG opened at $152.01, above the prior day’s high of $146.23, on 1.31× volume, and closed at $148.18. Common, breakaway, runaway, or exhaustion?
Answers
- Q1: A long lower wick with the close in the top 5% of the day’s range means sellers pushed it down and buyers took it all back. It happened right inside the support zone, which is what makes it a hammer in context instead of just a big wick. The gap down didn’t follow through; it was fully filled on Sep 23.
- Q2: Sideways. Highs kept stalling around $153–154 and lows kept holding around $139–142, so there was no stair-step of higher highs and higher lows, or lower highs and lower lows. Before Mar 18 it was a downtrend from the $167.25 high on Feb 27.
- Q3: A common gap. It was inside a range, volume was only modestly above average, it closed well off the open, and it filled within three sessions (Apr 29 low $145.89). It also ran straight into the ceiling area; the high was $152.42.
The one idea
Support is a price area where buyers have stepped in again and again. Resistance is an area where sellers have capped the price again and again. They exist because people remember prices: buyers who missed the last low want in at that price again, and holders stuck from a high want out at break-even. Think of them as zones, not razor-thin lines.
How to draw them
- Start with the obvious swing lows and highs, the turning points you can see without squinting.
- Look for at least two or three turns at about the same price. Draw a band wide enough to hold the wicks, not a single line through one candle.
- A level gets more important with more touches, more time, and heavier volume at the turns. Prior highs and round numbers add weight; that’s lesson 9.
- Work at the edges. The middle of a range is where you have no edge, because the next move could go either way.
What to look at on PG
- The floor, about $139–142: 12 separate swing lows tested it between Mar 27 and Sep 10. The deepest dip was $138.86 on Jun 1, and no close went below $140.19.
- The ceiling, about $153–154: five rallies stalled there between Jun 16 and Jul 28, topping out at $154.32 on Jul 17.
- Oct 14: PG closed at $156.53, its first close above the ceiling since Mar 10, on 1.26× average volume. That’s a start, but volume is only modestly above normal. Unit 3 looks for 40–50% or more on a real breakout. Yahoo lists earnings on Oct 22, which can easily undo or confirm the move.
- What’s overhead now: the Mar 10 high of $157.15, then the February highs, $159 up to $167.25.
- The dashed box: in early March, $152–157 was where PG was holding. It broke on Mar 18, and that same area turned into the June–July ceiling. That flip is tomorrow’s lesson.
Rule of thumb
Before any trade, mark the nearest support below and the nearest resistance above. If price is close to support, your stop can sit just under the zone and the risk is small. If price is jammed up under resistance, the room to run is small. If it sits in the middle, wait. A break counts when a candle closes clearly beyond the zone, ideally on above-average volume, and then holds over the next few sessions.
Common mistake
Drawing the level to the penny and treating a small poke through it as a breakdown. On Jun 1, PG slipped to $138.86, a bit under the cluster of earlier lows, and closed at $140.28, still inside the zone. Anyone who sold that “break” sold close to the low: four sessions later, on Jun 5, it closed at $146.54. A zone is allowed to be a little messy. Wait for a decisive close beyond it.
Try it
Open the RSKD daily chart for the last six months. Mark the one clearest floor and the one clearest ceiling, and count how many times each was tested. Then answer one question: is RSKD at an edge right now, or in the middle of its range?
Charts use real Yahoo daily data. Part of Invest’s 90-day chart course.