Gaps: breakaway, runaway, exhaustion
The one idea
A gap is empty space on the chart: today’s whole range sits above yesterday’s high (gap up) or below yesterday’s low (gap down). It means something changed overnight, usually earnings or news, and buyers or sellers had to reprice at once. Where the gap happens in the trend tells you what kind it is, and that decides whether you lean on it or get careful.
The four kinds
- Common gap: small, inside a sideways range, ordinary volume. Usually gets filled within days. Ignore it.
- Breakaway gap: jumps out of a base or range on heavy volume. It starts a new trend. Strong ones often never fill.
- Runaway (continuation) gap: happens in the middle of an established move, again on big volume. Buyers are so eager they won’t wait for a pullback. The gap zone often becomes support later.
- Exhaustion gap: comes late, after a long run, often on huge volume, but price can’t hold it. A weak close, a quick fill, and no new high afterward are the signature. It marks the end of that leg.
What to look at on SNOW
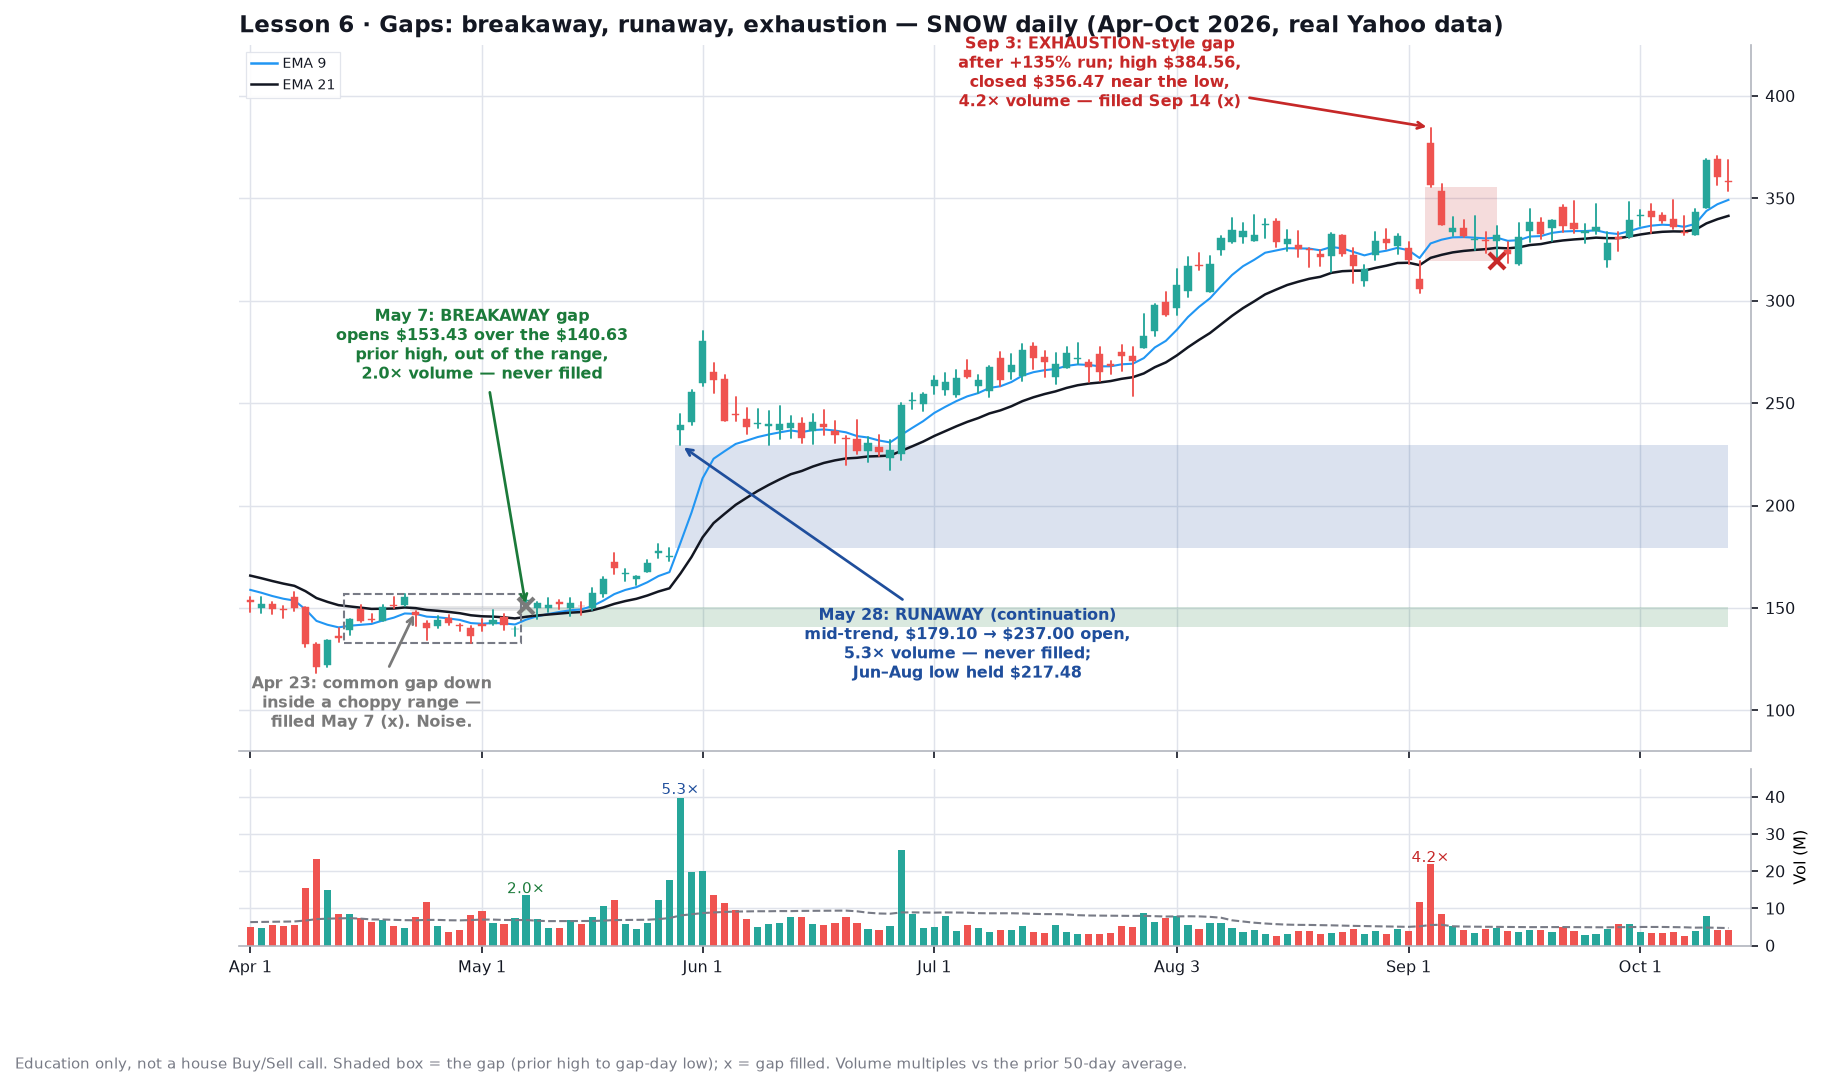
- Apr 23, common gap down: opened $147.85, under the prior day’s $151.01 low, while SNOW was chopping between roughly $133 and $157. It was filled on May 7. Noise.
- May 7, breakaway gap: opened $153.43 over the prior high of $140.63, popping out of that choppy range on 2.0× average volume. The gap never filled; the lowest low since is $144.48.
- May 28, runaway gap: SNOW was already climbing from about $140 to $175 when it opened at $237.00 over a prior high of $179.10 (about +35% from the prior close) on 5.3× volume. It ran to $284.99 by Jun 1. The pullback through August bottomed at $217.48, still above the gap, so the gap held as support.
- Sep 3, exhaustion-style gap: after roughly a 135% run from about $140 to about $330, it opened at $377.24 (+23% from the prior close) on 4.2× volume. It hit $384.56 but closed $356.47, near the low. The next day closed $337.18, and the gap filled on Sep 14. SNOW hasn’t traded above $384.56 since. The highest high since then is $370.55. It didn’t crash; it went sideways, roughly $317–$370. Exhaustion ended the leg, not necessarily the stock.
Rule of thumb
Ask three questions about any gap: (1) Where in the trend is it, at the start out of a base, in the middle, or late after a big run? (2) Is volume at least 1.5–2× average? (3) Does the gap hold in the next few sessions? A breakaway or runaway gap that holds is strength; its lower edge (the prior day’s high) becomes a level to watch. A late gap that closes weak and fills fast is a warning to tighten stops or take some profit, not a place to add.
Common mistake
Chasing the open on a big late-stage gap like SNOW’s Sep 3. The headline looks the most exciting right when the move is most stretched. Anyone who bought the $377 open was about 15% underwater within two weeks (the Sep 14 low was $319.00). The cleaner gap entries came earlier: May 7, out of the range, and May 28, before anyone called it extended.
Try it
On the PLTR daily chart, find the last gap of 2% or more. Mark the prior day’s high or low, check volume against the 50-day average, and decide: common, breakaway, runaway, or exhaustion? Then check whether it has filled yet.
Charts use real Yahoo daily data. Part of Invest’s 90-day chart course.