Reversal candles in context: hammer, shooting star, engulfing
The one idea
A reversal candle is a one-day plot twist: buyers or sellers show up hard enough to leave a hammer, a shooting star, or an engulfing body. The shape is the clue. Context decides whether it matters — where you are in the trend, whether volume backs it, and whether the next day confirms.
The three shapes
- Hammer: small body near the top of the range, long lower wick (roughly 2× the body). Sellers drove it down; buyers bought the dip into the close.
- Shooting star: the mirror image — small body near the bottom, long upper wick. Buyers ran it up; sellers slammed it back.
- Engulfing: today’s body fully swallows yesterday’s body, opposite color. Bullish engulfing after a red day; bearish engulfing after a green day.
What to look at on ADBE
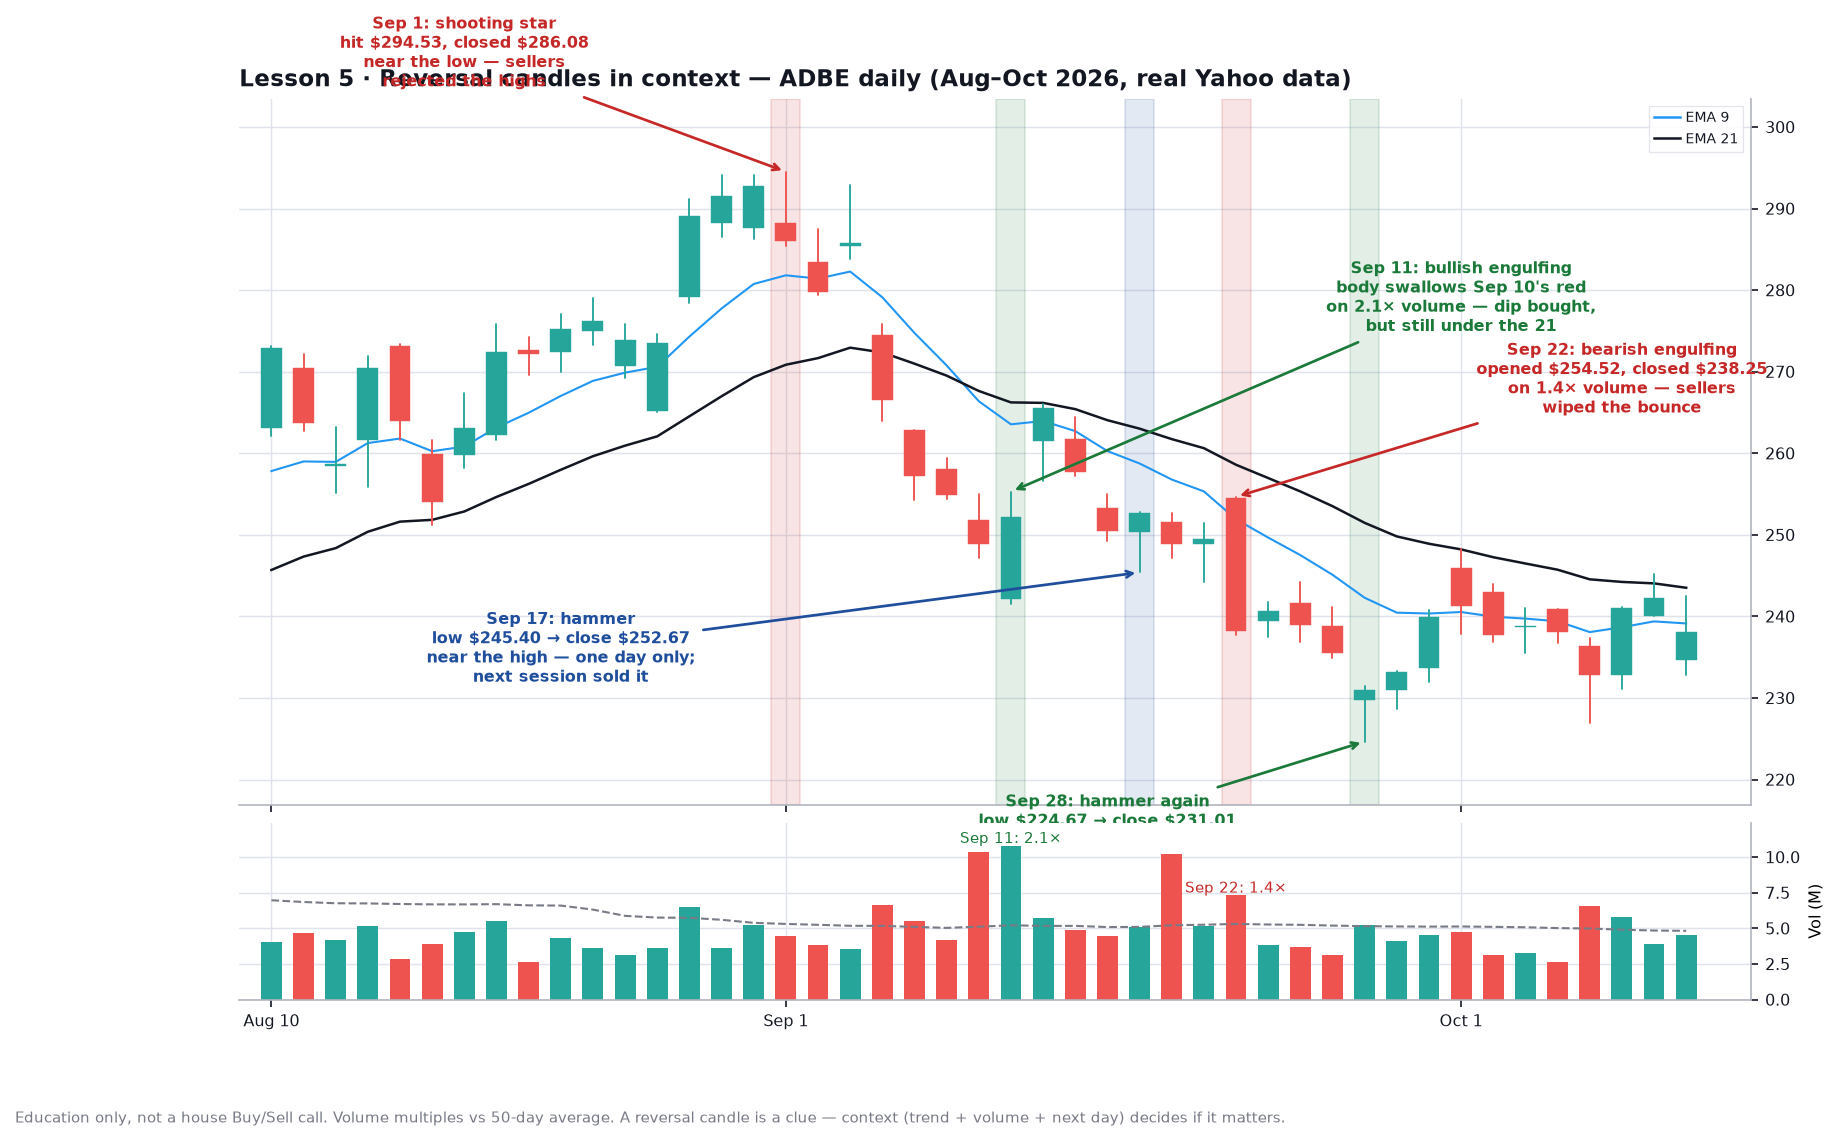
- Sep 1 shooting star: hit $294.53 and closed $286.08 near the low. That rejected the highs. Over the next two weeks price fell into the mid-$240s.
- Sep 11 bullish engulfing: green body swallowed Sep 10’s red body on 2.1× average volume. Dip got bought — but price was still under the 21 EMA, so it was a bounce inside a downtrend, not a new uptrend.
- Sep 17 hammer: low $245.40, close $252.67 near the high. Classic shape on about average volume. Next session sold it. One hammer without follow-through is noise.
- Sep 22 bearish engulfing: opened $254.52, closed $238.25 on 1.4× volume and wiped the bounce. Context matched the shape: sellers were already in charge.
- Sep 28 hammer: low $224.67, close $231.01. Another dip-buy day, then a brief bounce. Same lesson — wait for confirmation.
Rule of thumb
Read the candle, then ask three questions: (1) Are we at a meaningful high or low, or mid-range noise? (2) Is volume above average? (3) Does the next day confirm (follow-through in that direction) or undo it? Until those line up, treat the candle as a watchlist flag, not an entry.
Common mistake
Buying every hammer in a downtrend under the 21 EMA. Lesson 2 already showed that on LULU — a pretty candle with no trend context is just a bounce. Same rule here on ADBE’s Sep 17 and Sep 28 hammers.
Try it
On the RSKD daily chart, find the last shooting star or hammer. Note the date, volume vs the 50-day average, and what the next two closes did. Did context agree with the candle?
Charts use real Yahoo daily data. Part of Invest’s 90-day chart course.