Weekend review + quiz
Quick recap of Lessons 1–3
- Lesson 1 — Trend is a staircase. Uptrend = higher highs + higher lows. Downtrend = lower highs + lower lows. Mark the last two swing highs and the last two swing lows before you trust any indicator.
- Lesson 2 — Candle anatomy. Body = open-to-close. Wicks = rejected extremes. Where the close lands tells you who won the day: near the high = buyers, near the low = sellers.
- Lesson 3 — Spot the trend. Ignore the last few candles. Ask whether peaks and dips are both climbing, both falling, or mixed/flat. Mixed or flat = sideways, and that is usually sit-out territory.
Review walkthrough — XOM
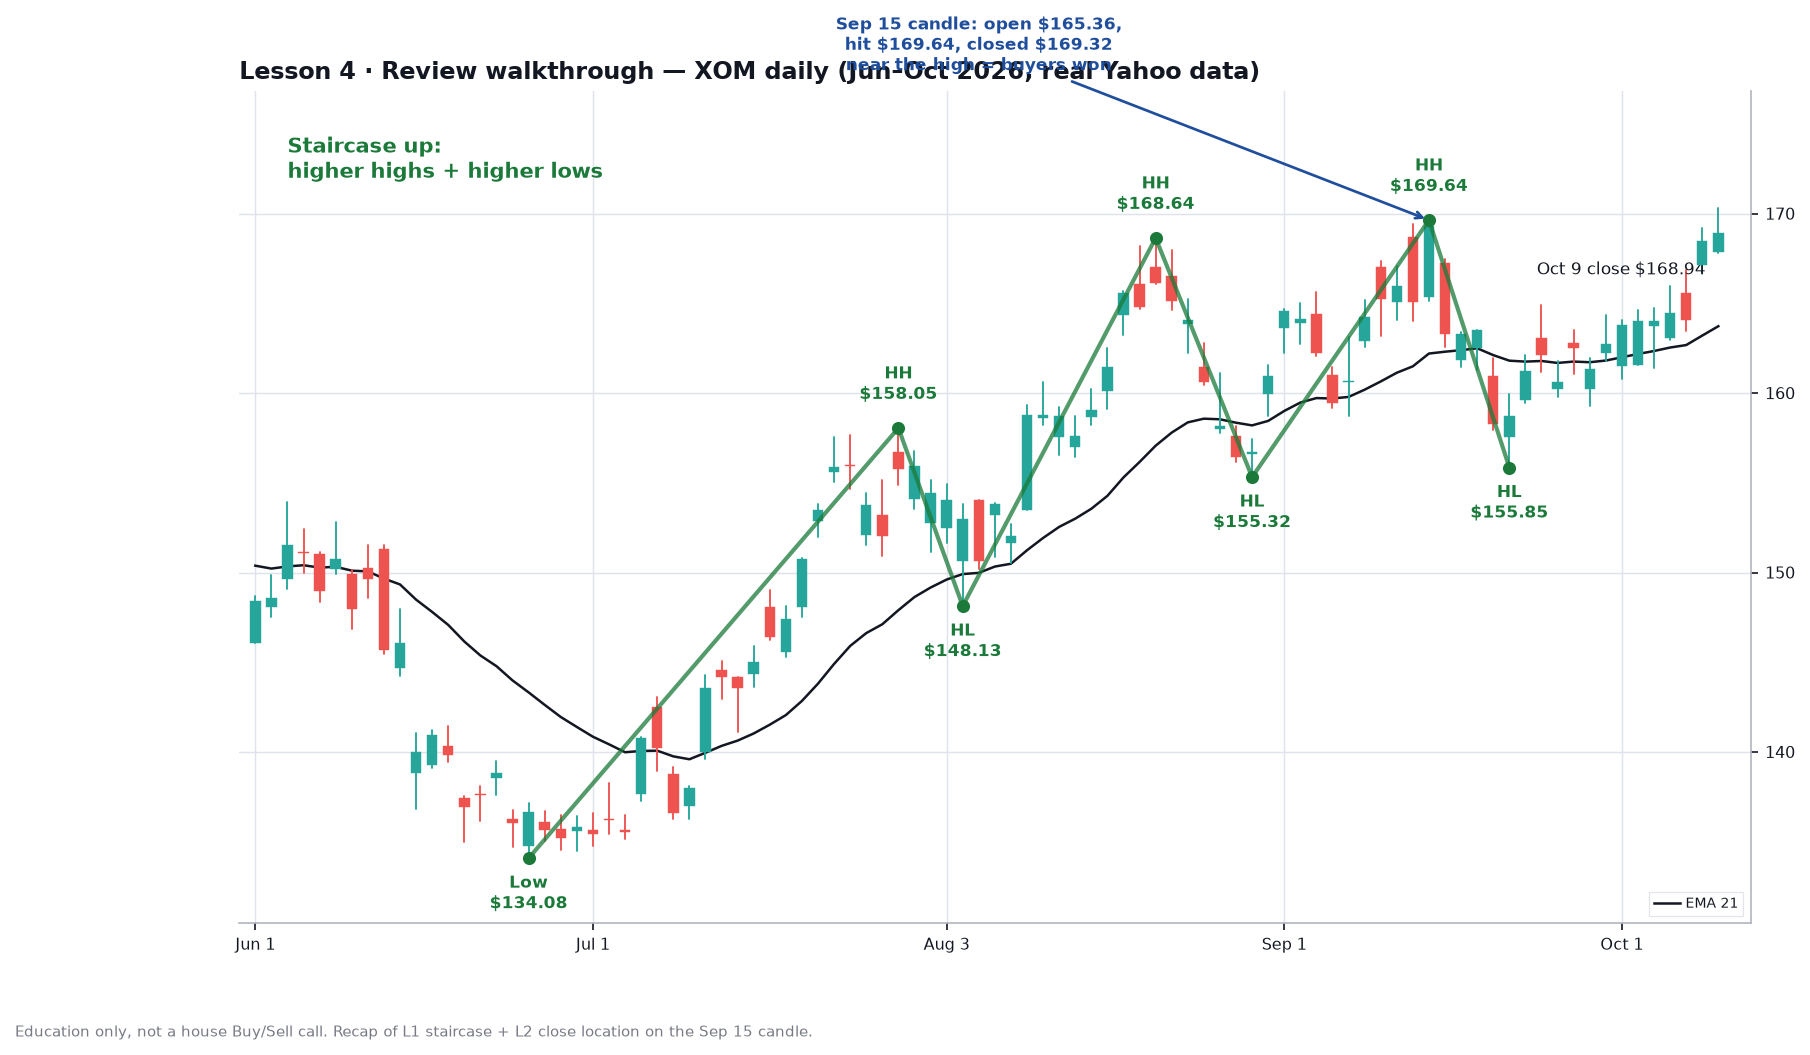
From the June low at $134.08, XOM climbed a clean staircase: highs $158.05 → $168.64 → $169.64, lows $148.13 → $155.32 → $155.85. That is Lesson 1 in one picture. On Sep 15 it opened at $165.36, traded up to $169.64, and closed at $169.32 — almost at the high — so buyers won that day (Lesson 2). It closed Oct 9 at $168.94, still above the rising 21 EMA.
Quiz
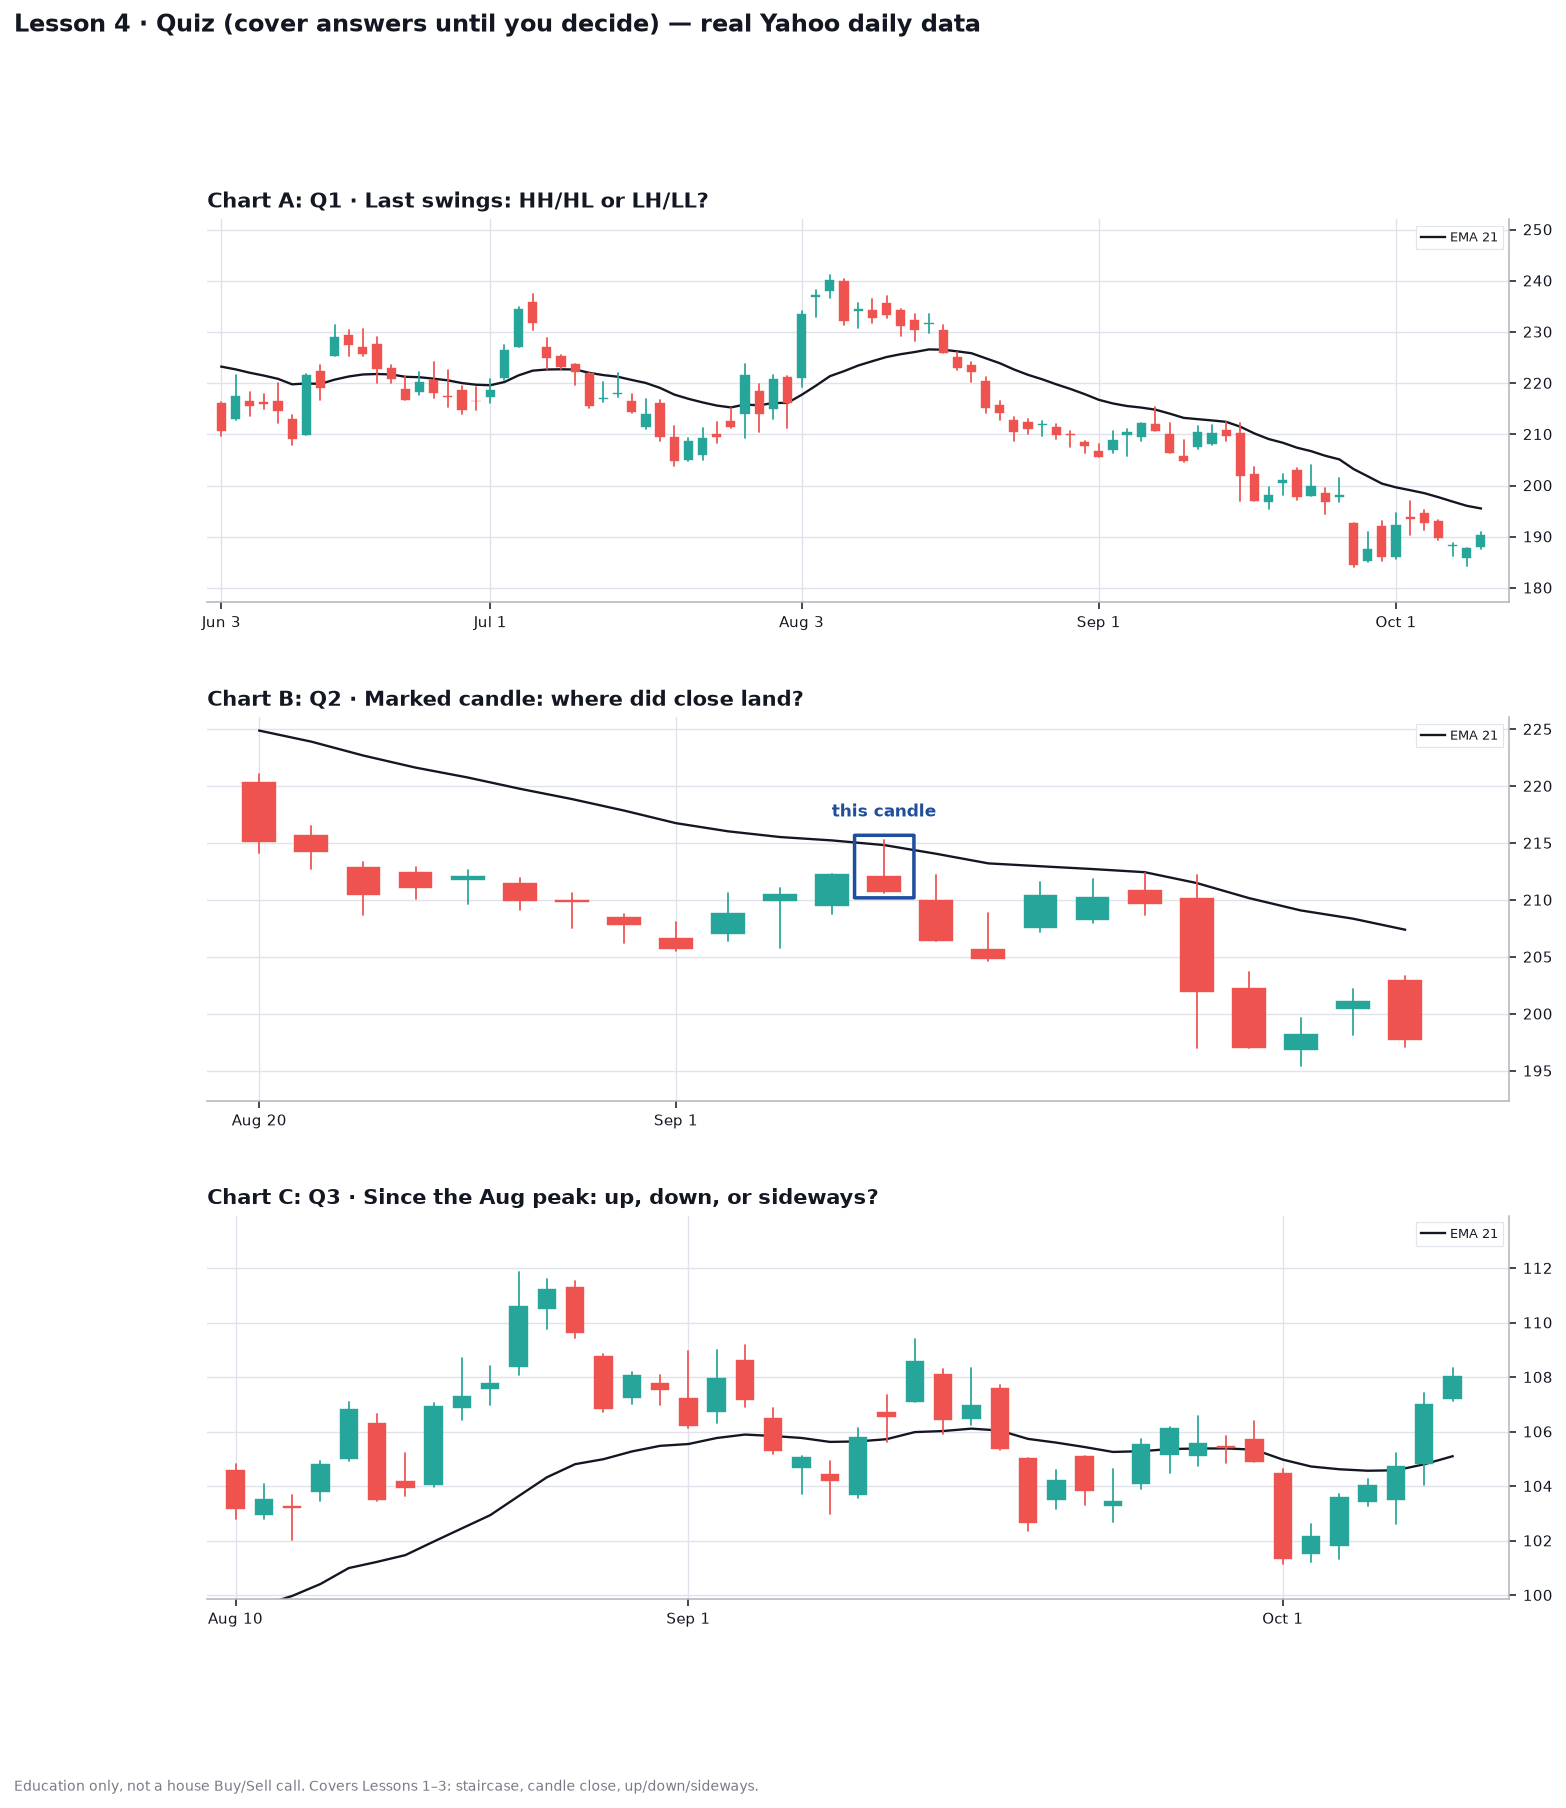
Cover the answers chart. Decide on each unlabeled panel before you peek.
- Q1 (Chart A): Are the last swings HH/HL or LH/LL?
- Q2 (Chart B): On the marked candle, where did the close land, and who won the day?
- Q3 (Chart C): Since the August peak, is it up, down, or sideways?
Answers
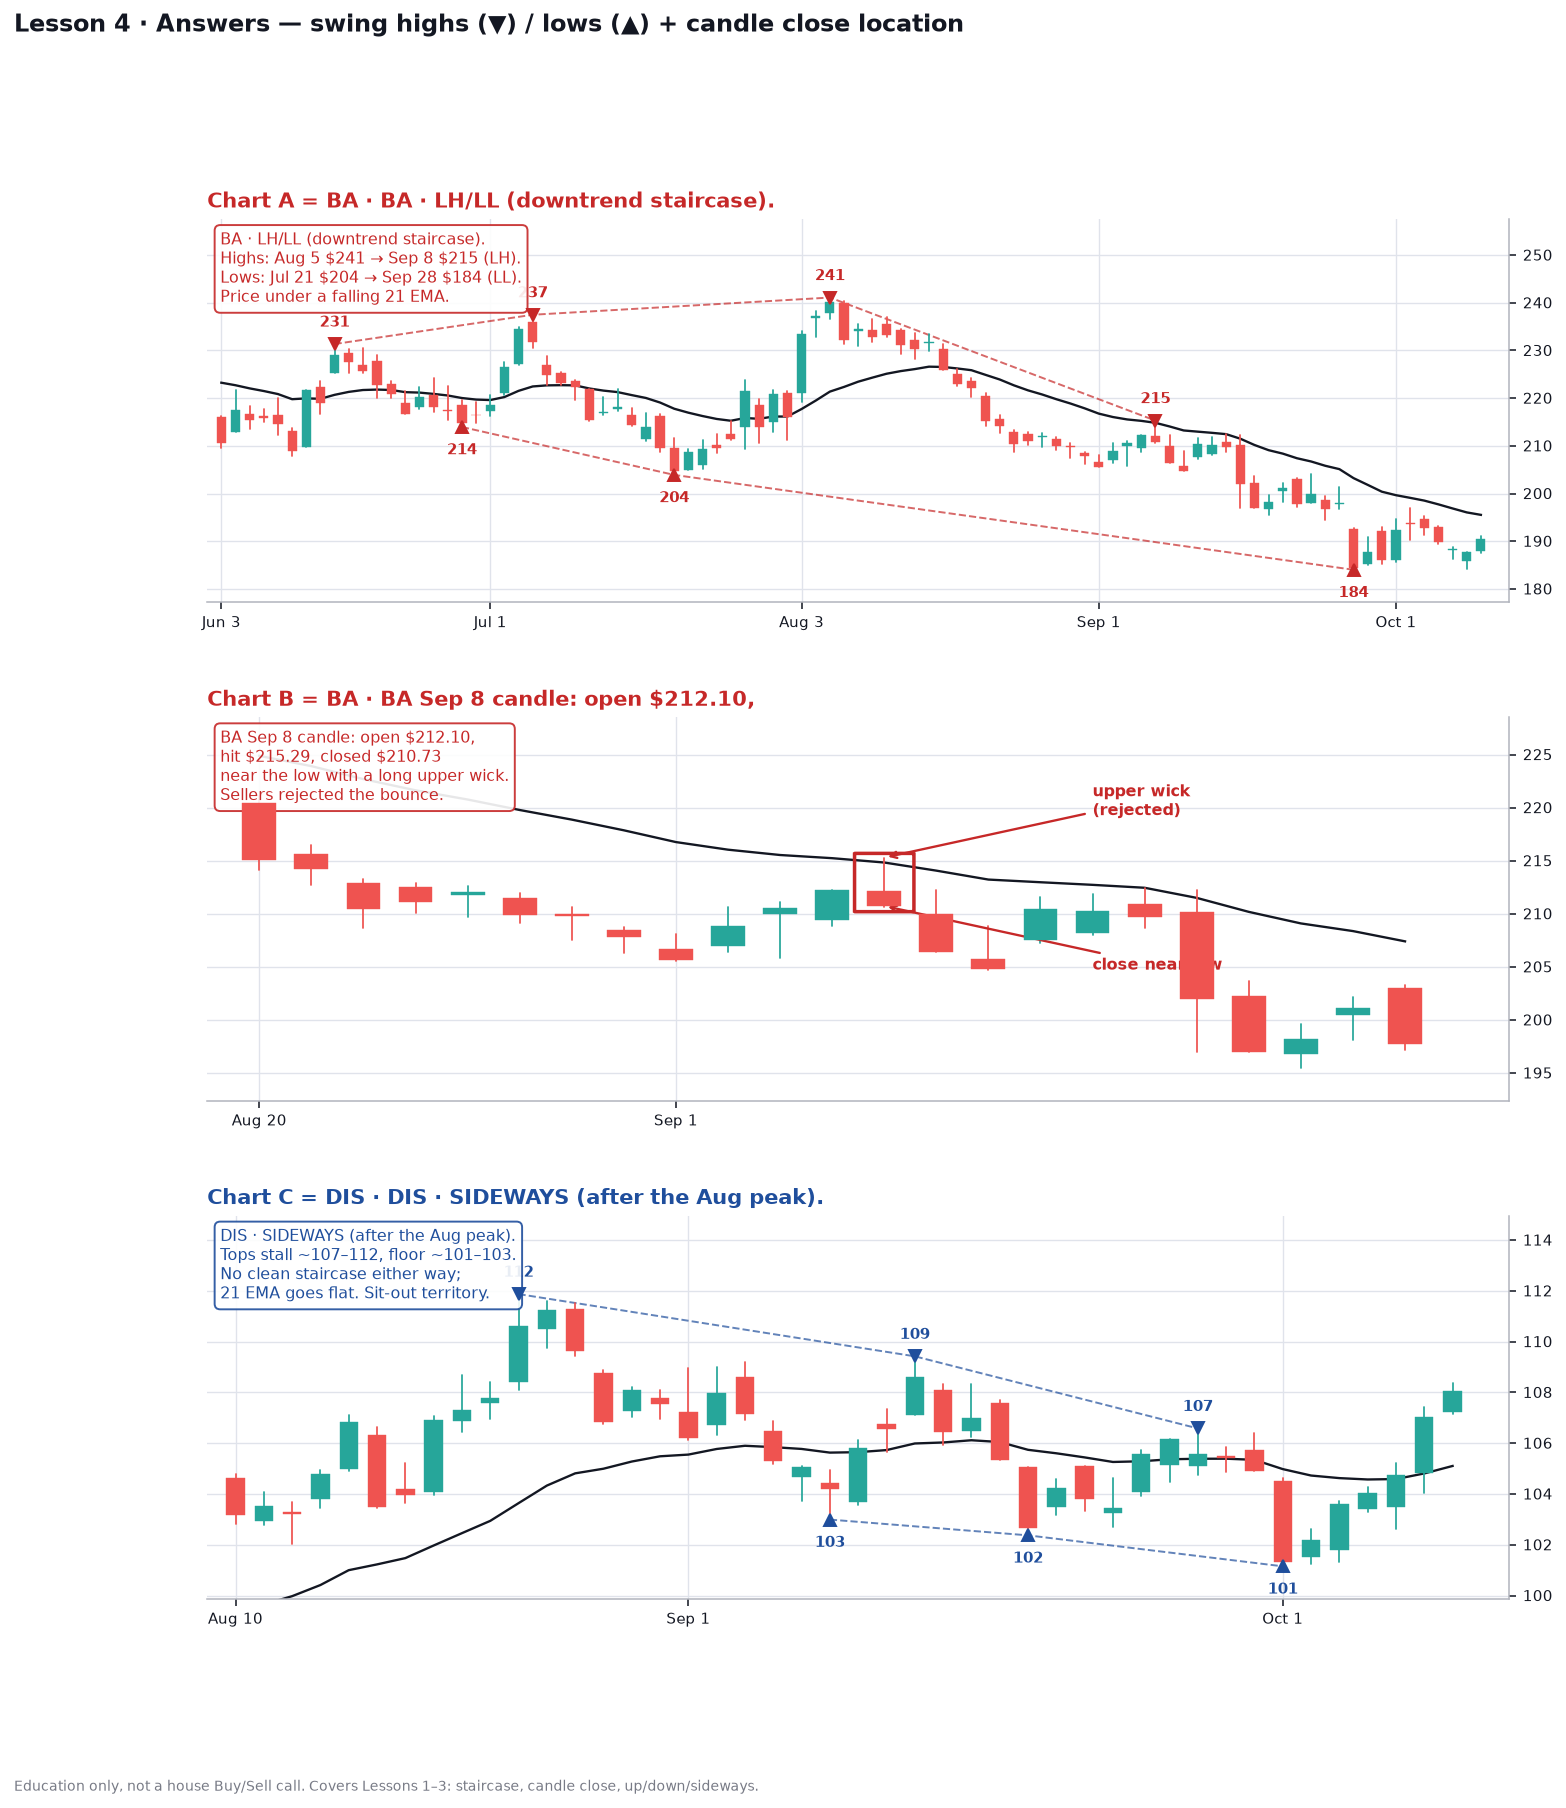
- Chart A is BA, LH/LL (downtrend). Highs fell from Aug 5 $241 to Sep 8 $215. Lows broke from Jul 21 $204 to Sep 28 $184. Price stayed under a falling 21 EMA.
- Chart B is BA’s Sep 8 candle. Open $212.10, high $215.29, close $210.73 near the low with a long upper wick. Sellers rejected the bounce.
- Chart C is DIS, sideways after the Aug peak. Tops stalled around 107–112 and the floor sat around 101–103. No clean staircase; the 21 EMA went flat. Sit-out territory.
Common mistake
Calling Chart C an uptrend because of the late bounce into October. Swings, not the last three green candles, decide the label.
Try it
Open any name you follow. Mark the last two swing highs and lows, then pick one recent candle and say where the close landed. Does your staircase match up, down, or sideways?
Charts use real Yahoo daily data. Part of Invest’s 90-day chart course.