Spot the trend (weekend drill)
How to read them
Ignore the noise and find the swing highs (the peaks) and swing lows (the dips), like Lesson 1. Ask: are the peaks getting higher or lower? Are the dips getting higher or lower? Both higher = uptrend. Both lower = downtrend. Mixed or flat = sideways.
Rule of thumb: you only need the last two or three swings. Most of the time, the 21 EMA’s slope agrees with the staircase.
Quiz charts
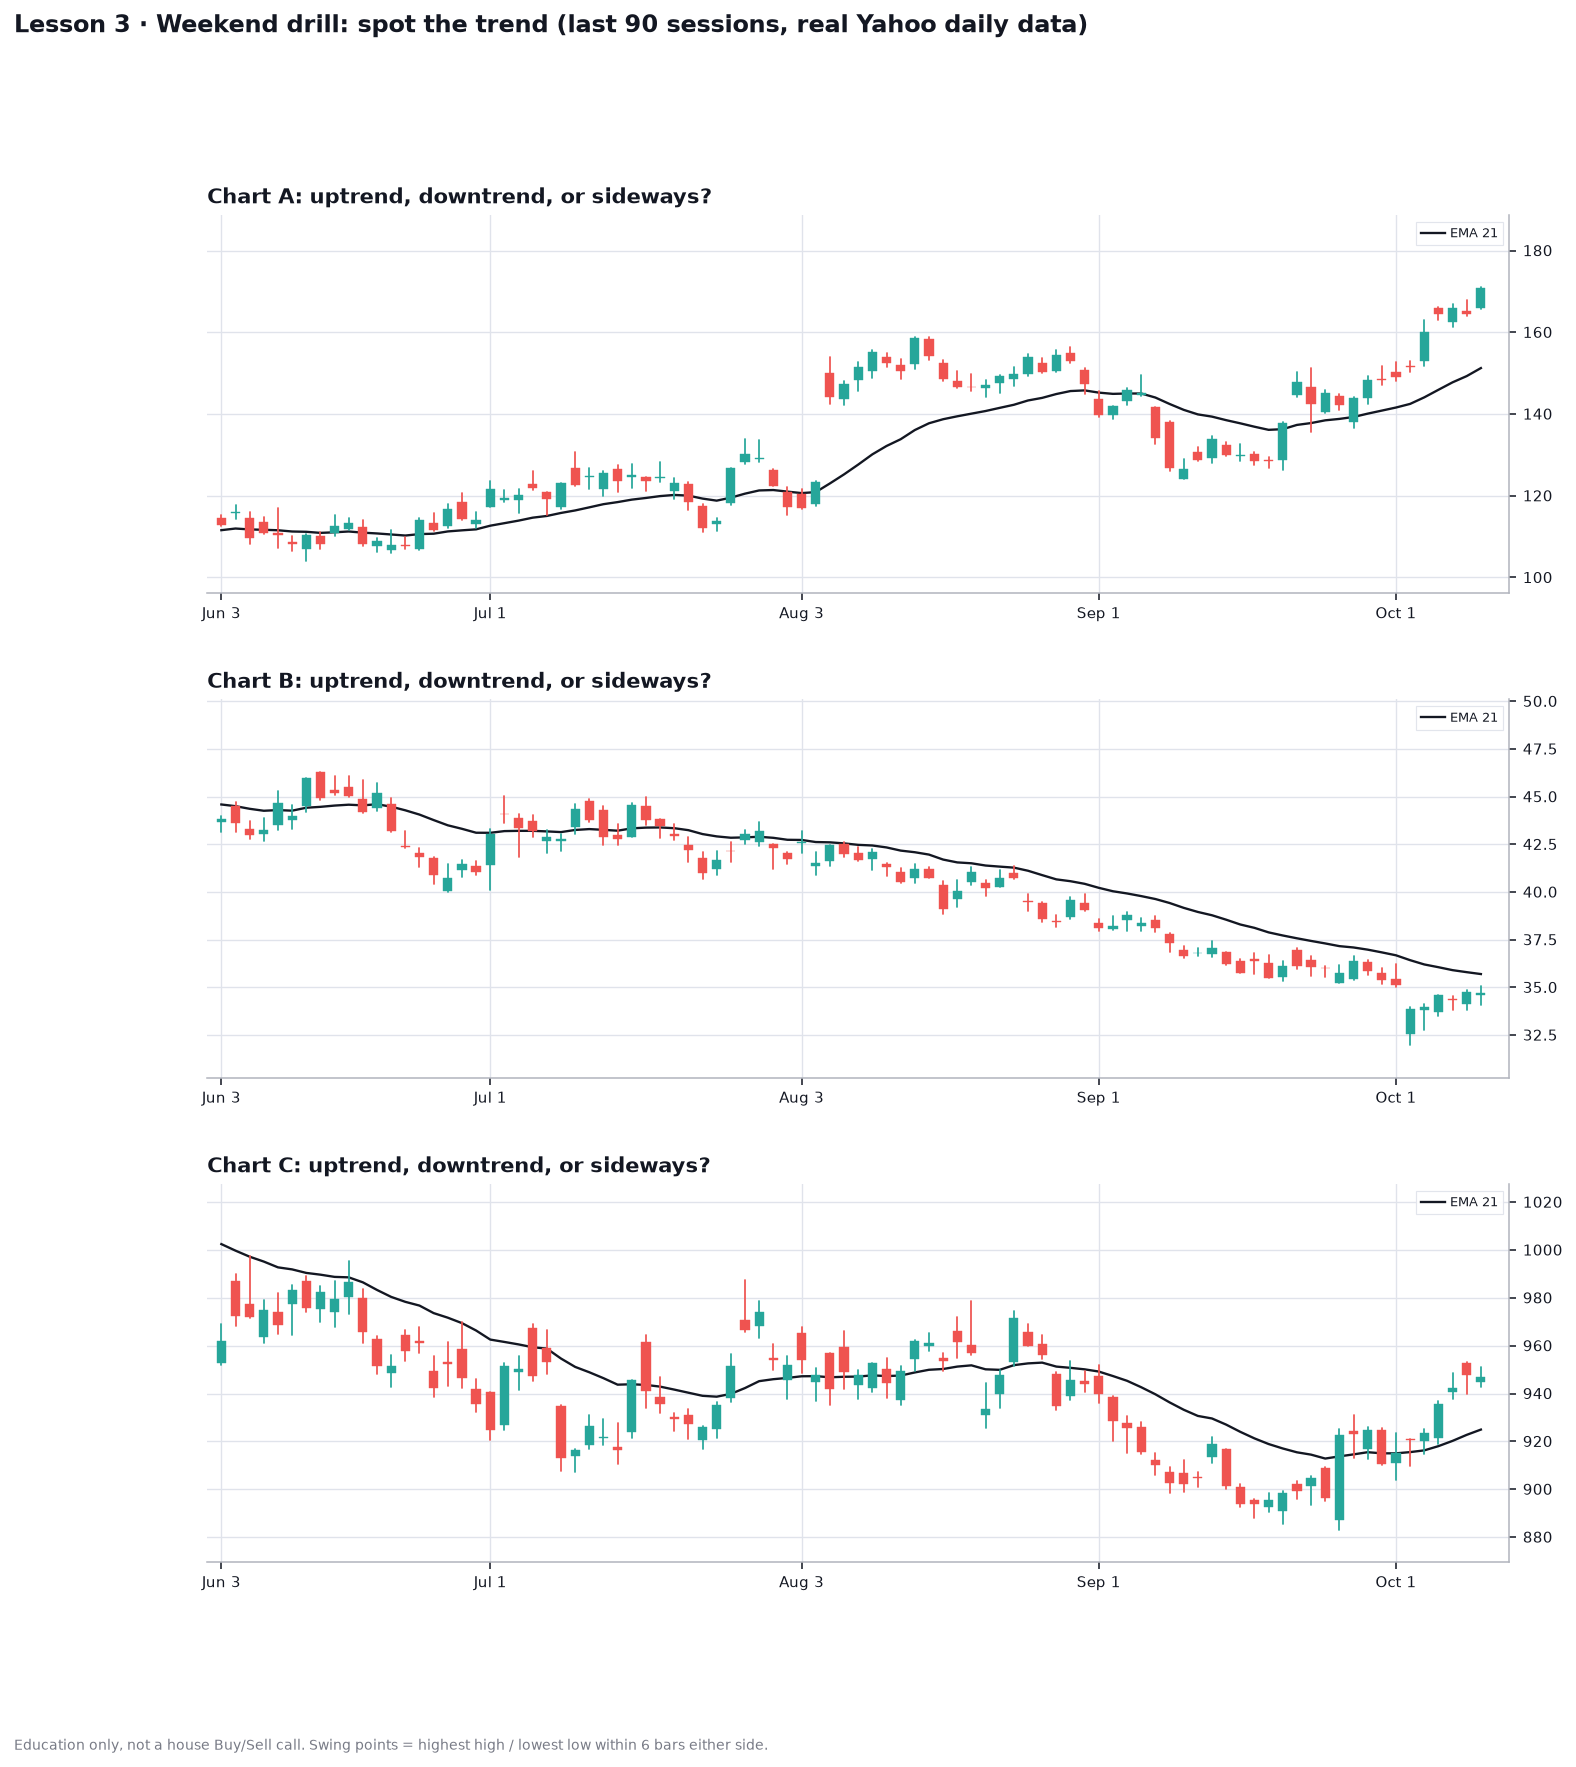
Decide up / down / sideways for each unlabeled chart before you look at the answers.
Answers
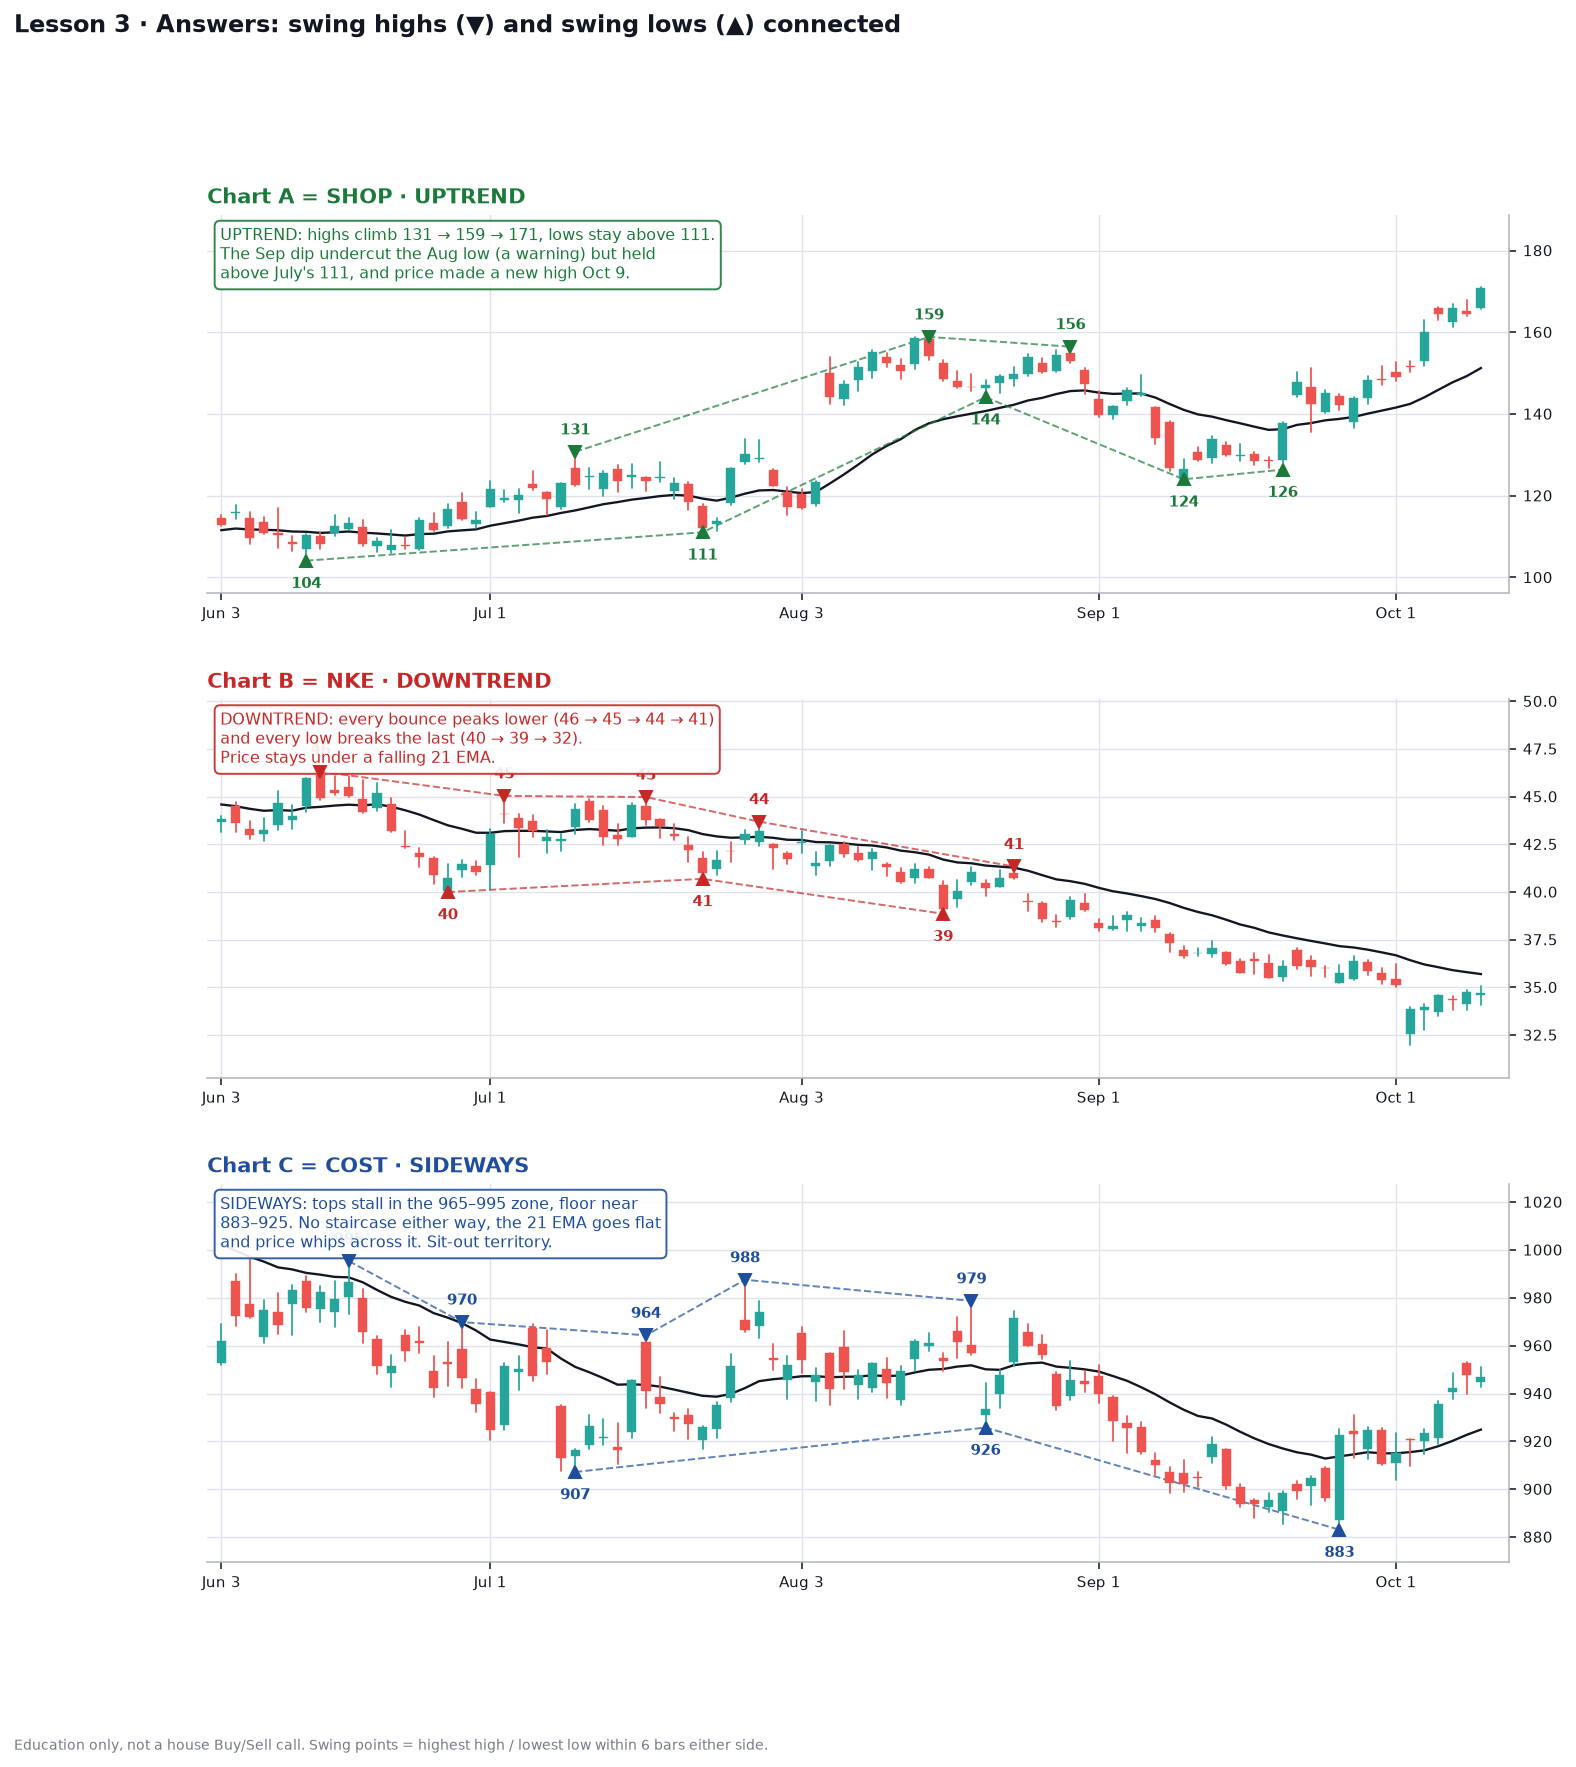
- Chart A is SHOP, an uptrend. Peaks climbed from about 131 → 159 → 171, and it made a new high Oct 9. The September dip fell below the August low (a warning), but it held above July’s 111 low and recovered to new highs.
- Chart B is NKE, a downtrend. Every bounce peaked lower (46 → 45 → 44 → 41) and every dip broke the one before it (40 → 39 → 32). Price stayed under a falling 21 EMA.
- Chart C is COST, sideways. Tops stalled around 965–995 and the floor sat around 883–925. No staircase either way; price kept crossing a flat 21 EMA. Sit-out territory.
Common mistake
Judging by the last few candles instead of the swings. COST’s bounce into October looks like an uptrend if you only look at the last week.
Try it
Pull up any stock you follow and mark its last three swing highs and lows. Which of these three charts does it look most like?
Charts use real Yahoo daily data. Part of Invest’s 90-day chart course.