Candle anatomy: where the close lands tells you who won the day
The one idea
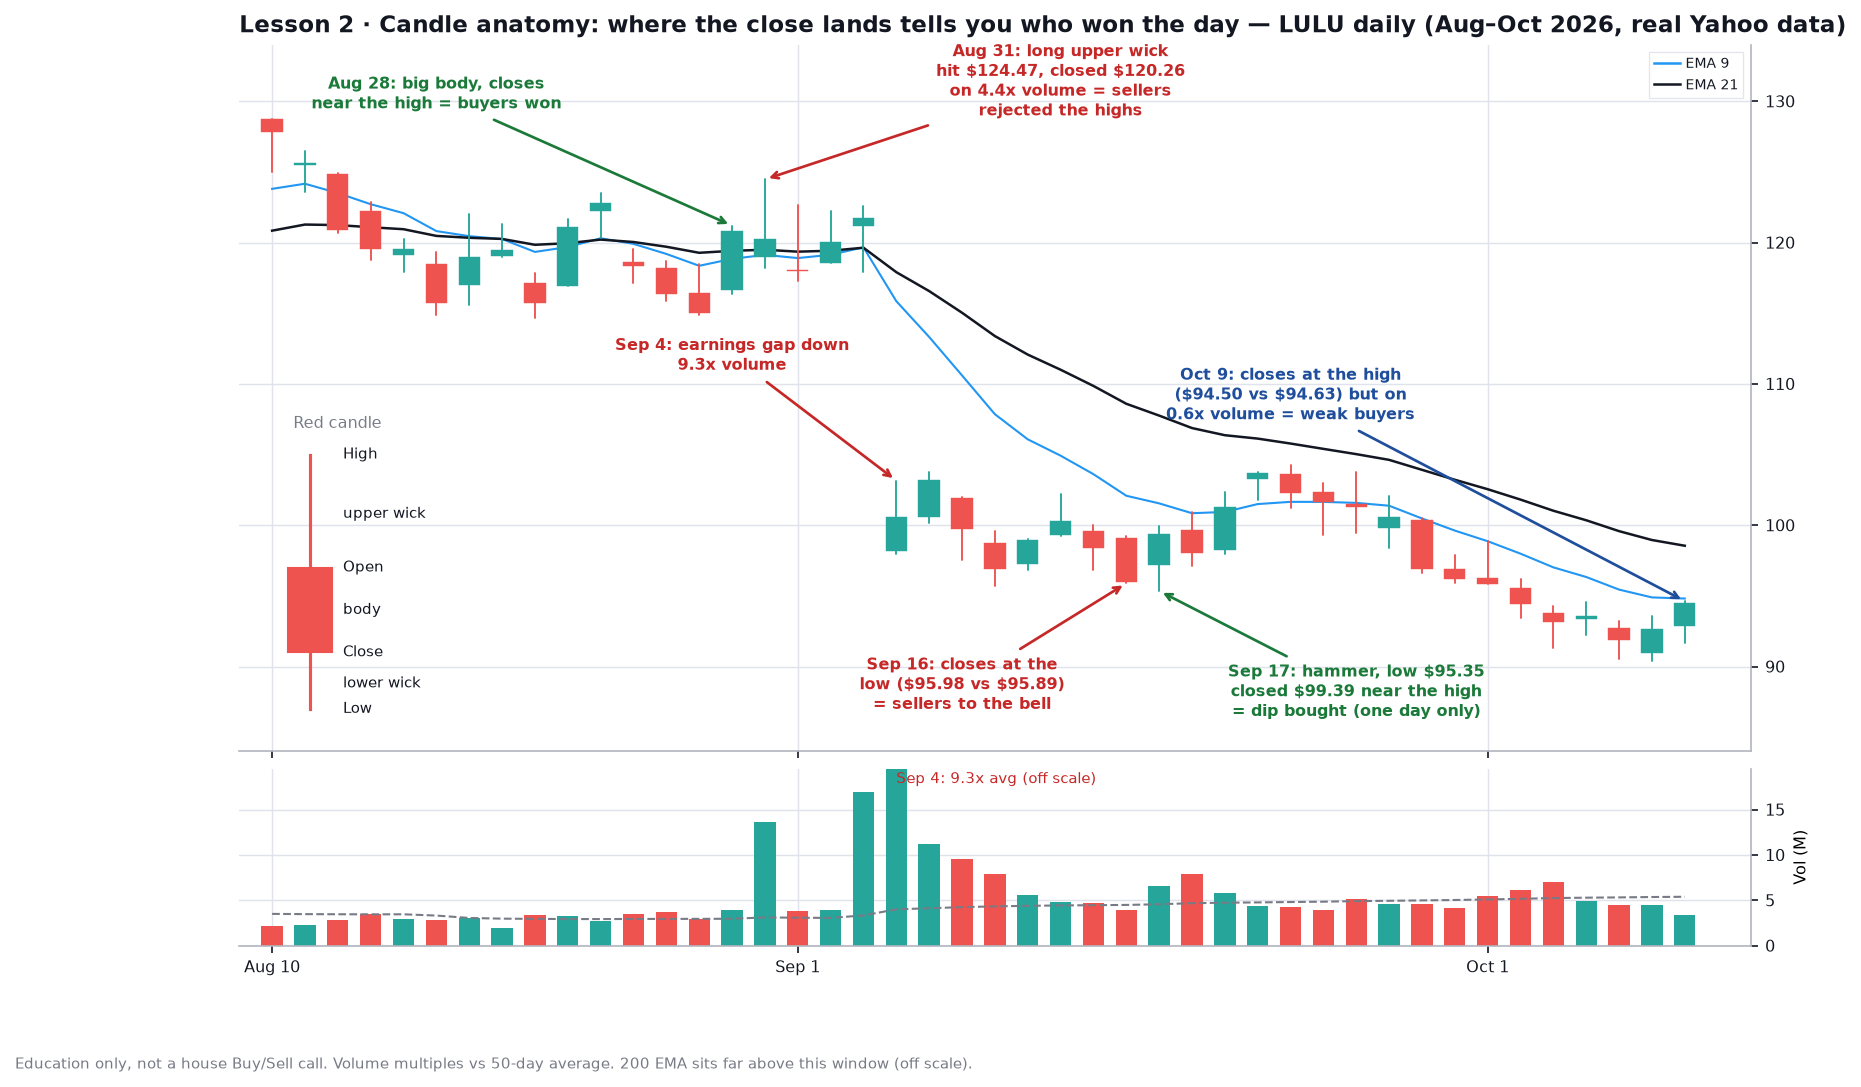
Every candle is a fight between buyers and sellers. The body runs from the open to the close, and the wicks show how far price got pushed before it was rejected. The most useful single clue is where the close sits inside the day’s range.
What to look at on LULU
- Aug 28: big green body that closes near the high. Buyers won the whole day.
- Aug 31: long upper wick. LULU hit $124.47 but closed at $120.26, on 4.4× normal volume. Sellers slammed the door at the highs, and four sessions later the earnings gap took it to about $100 on 9.3× volume.
- Sep 16: closed basically at the low ($95.98 against a $95.89 low). Sellers were in control right into the bell.
- Sep 17: hammer. It dipped to $95.35 and closed near the top at $99.39, so the dip got bought. But it was one day only, and the downtrend under the 21 EMA kept going.
- Oct 9: closed right at the high ($94.50 against $94.63), but on only 0.6× volume. That’s a nice candle with weak buyers behind it.
Rule of thumb
A close in the top quarter of the range means buyers won, and the bottom quarter means sellers won. A long wick means price was rejected there. Always check two things before trusting a candle: volume (above average counts, light volume doesn’t) and location (one strong candle in a downtrend under the 21 EMA is a bounce, not a turn).
Common mistake
Reading a single candle with no context. A hammer or a strong close means little until the next day confirms it and the trend structure from Lesson 1 agrees.
Try it
Pull up the RSKD daily chart and find the last candle with a long upper wick. Was volume above or below average that day, and what happened over the next three sessions?
Charts use real Yahoo daily data. Part of Invest’s 90-day chart course.