A trend is a staircase
The one idea
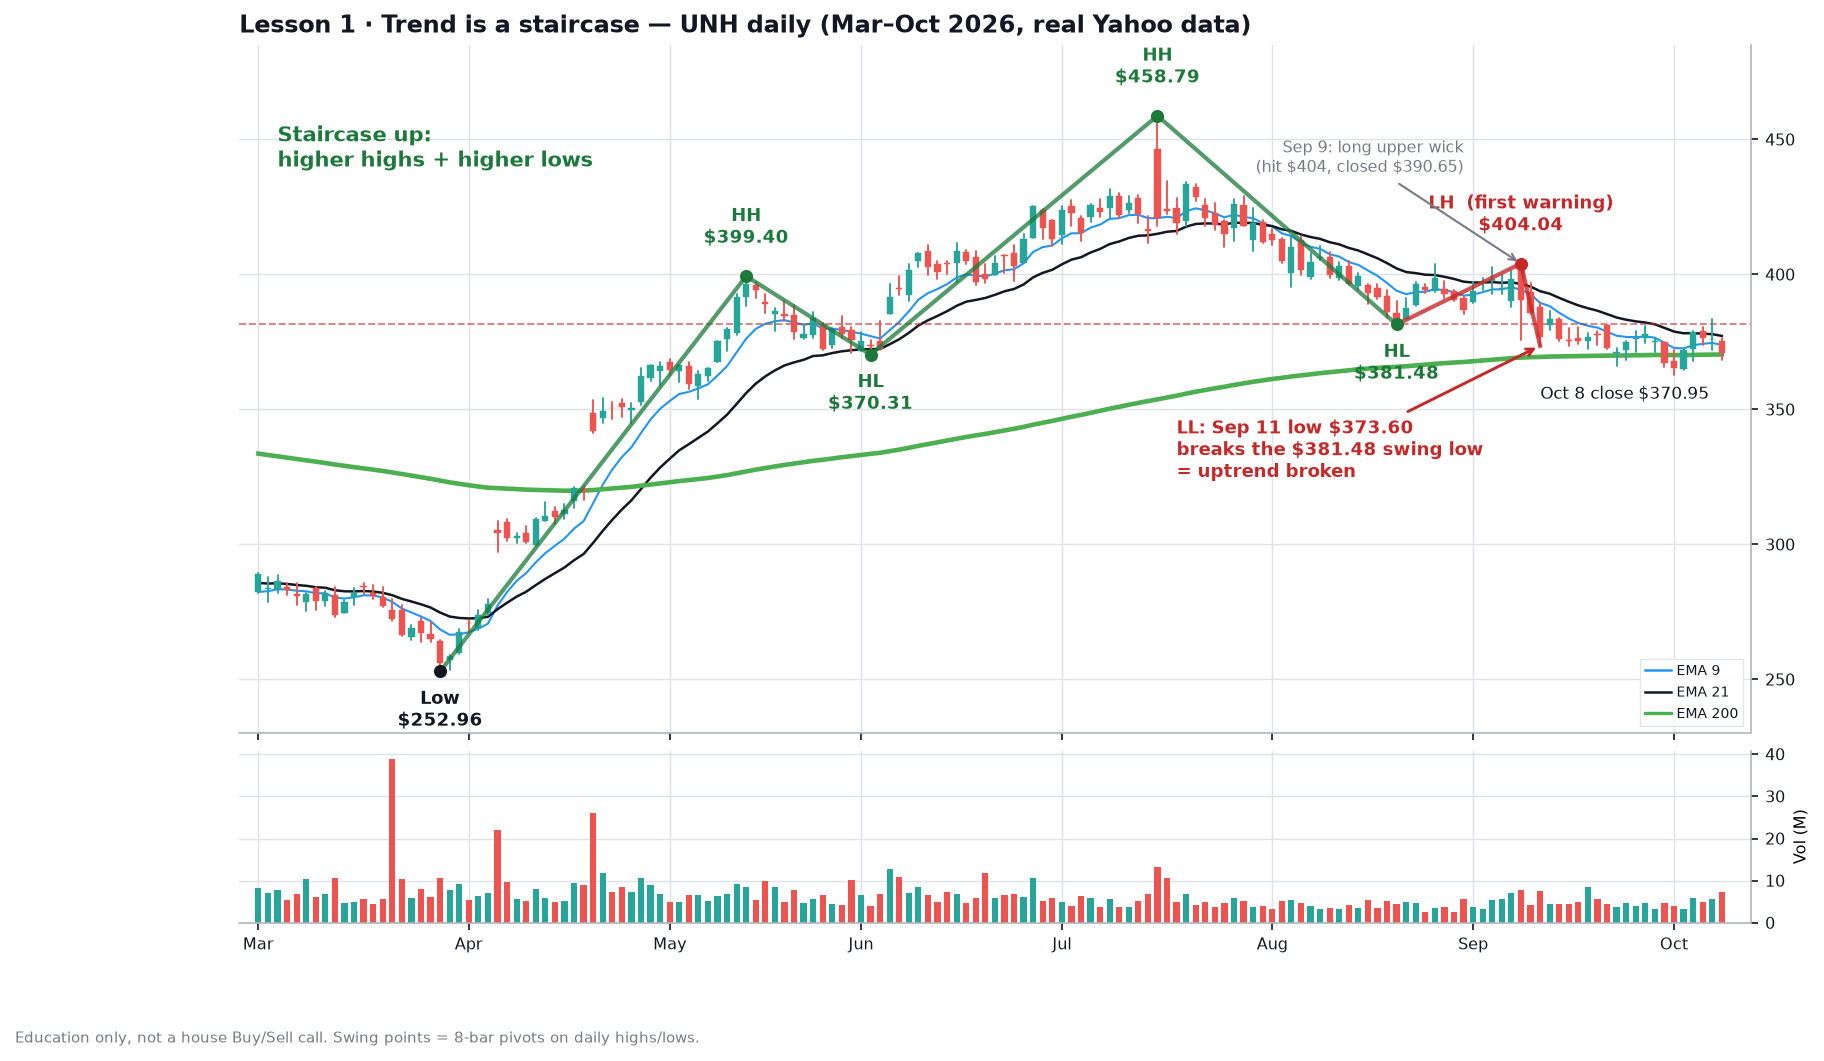
An uptrend is just higher highs and higher lows, step after step. A downtrend is the mirror image, with lower highs and lower lows. Before you look at any indicator, find the last two swing highs and the last two swing lows.
What to look at on UNH
From March to July it climbed a clean staircase. The lows went $252.96, then $370.31, then $381.48, and the highs went $399.40, then $458.79. Then on Sep 9 the bounce topped out at $404.04, well under the July high. That’s the first lower high, and it’s a warning. The Sep 9 candle also traded up to $404 and closed at $390.65, leaving a long upper wick where sellers stepped in. Two days later, on Sep 11, it dropped to $373.60, under the $381.48 swing low. That lower low is what confirms the uptrend is broken. It has gone sideways to lower since then and closed at $370.95 on Oct 8.
Rule of thumb
A lower high is a yellow light. A close under the last higher low is the red light, so the trend is no longer up. Stop treating dips as buy-the-dip until it builds a new higher low and gets back over a recent swing high.
Common mistake
Calling the trend from a single red day, or ignoring the first lower high because the stock still “looks strong” and is above the 200. UNH broke its staircase while it was still above its 200 EMA.
Try it
Pull up NVDA on the daily chart and mark the last two swing highs and the last two swing lows. Is it still a staircase up, or has it printed a lower high yet?
Charts use real Yahoo daily data. Part of Invest’s 90-day chart course.